
As Headlines Remain Negative, the U.S. Economy Chugs Along
In recent weeks, I have written extensively about tariff-induced economic uncertainty. Many analysts continue to call for a recession, and this past week the World Bank projected the U.S. economy would grow just 1.4% in 2025—down from 2.8% last year. To be fair, I think concerns about rising input costs, inflation, business investment, and consumer spending are all valid and should be monitored closely in the coming months.1
But as I write, the reality on the ground looks quite different from the gloomy outlook that tends to play out in financial media. The U.S. economy has largely been resilient, with worst-case scenarios on tariffs avoided while economic fundamentals remain stable and strong. This combination has been driving the market rally, in my view.2
An overview of recent economic data underscores my point. According to the Bureau of Labor Statistics, the U.S. economy added 139,000 jobs in May, firmly in positive territory. The unemployment rate remained unchanged at 4.2%, where it has hovered in a narrow range for over a year. This may seem unremarkable, but that’s also the point. The labor market isn’t booming or breaking—it’s steadily supporting growth.
Private Payrolls Have Grown at a Steady Pace in Recent Months
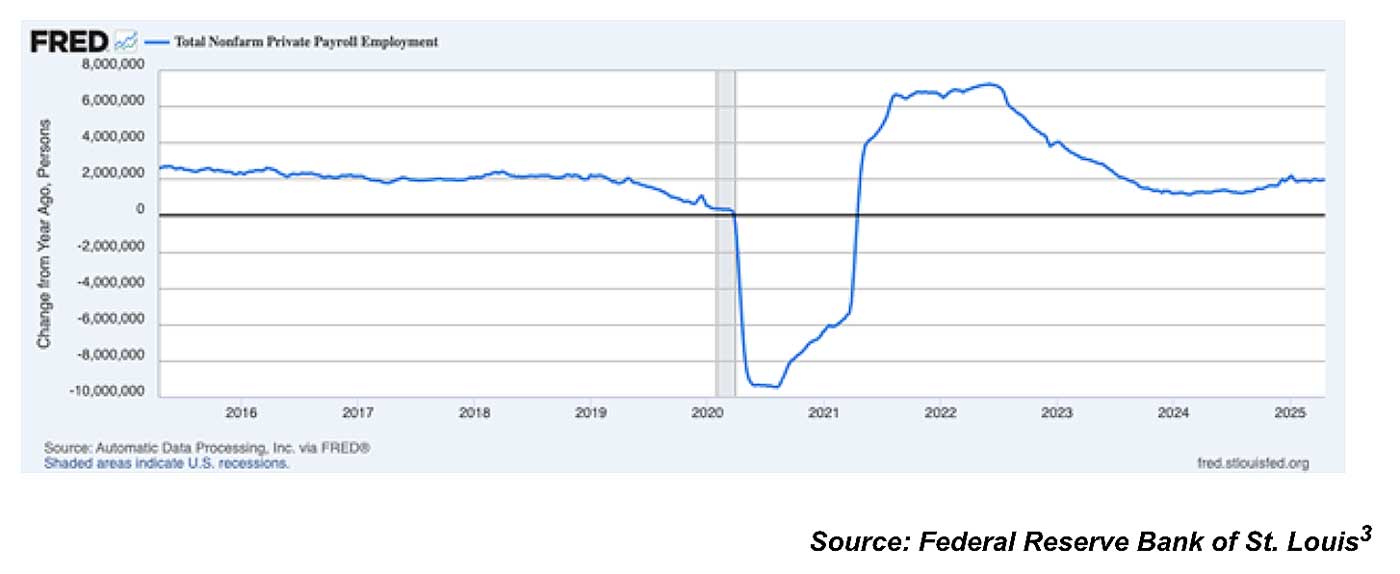
Importantly, private sector hiring continues to outpace job losses at the federal level, where government employment declined by 22,000. Wages also climbed in May, with average hourly earnings rising 0.4% month-over-month and 3.9% year-over-year. That’s comfortably above the current pace of inflation, helping to support real household income and consumer spending. It’s a key piece of data for markets, especially given concerns that rising prices would continue eroding purchasing power.
On the inflation front, recent data continues to suggest that the worst of the inflation shock is behind us. The Federal Reserve’s preferred measure, the PCE price index, rose just 2.1% year-over-year in April, putting it a mere tenth of a percentage point above the Fed’s long-run average inflation target. Some would argue that this opens the door for the Fed to resume rate cuts, which would serve as a tailwind for markets. I’m not in that camp. In my view, stocks don’t need rate cuts to do well.
I do not want to imply that the U.S. economy is firing on all cylinders, however. Retail sales, for example, were up 4.75% from a year ago but fell month-over-month in May. Consumer demand has clearly cooled from the post-pandemic surge, and forward momentum has become more uneven. Activity in the services sector, which drives most U.S. economic output, softened in May as the ISM Services PMI fell to 49.9, its first contraction in nearly a year. New orders fell, inventories declined, and pricing pressures appeared to pick up again, a combination that suggests businesses are feeling the weight of tariff uncertainty and are growing more cautious with forward planning.
The manufacturing sector also contracted for a third straight month in May, with the Manufacturing PMI registering 48.5. While some components like new orders and production showed slight improvement, others—such as inventories, exports, and employment—remained under pressure. These readings aren’t a signal of imminent collapse, but they do reinforce that certain areas of the economy are still contending with lag effects from prior shocks, policy uncertainty, and structural adjustments.
The bottom line, we are not seeing a uniform expansion across the economy, and that’s ok. It’s important for investors not to confuse economic resilience with gangbusters growth. The latter is not needed to power stocks higher.
Bottom Line for Investors
This kind of economic resilience doesn’t mean risk is lower today than it was before “Liberation Day.” As uncertainty over trade deals and future tariff actions remains high, I do not expect businesses and consumers to invest and spend confidently. The net effect could be a short or medium-term drag on growth.
At the same time, however, investors waiting for a clear, euphoric “all clear” may find themselves missing the recovery as it quietly continues. If you find yourself waiting for the next tariff plunder, inflation shock, or retracement of the stock market’s recent rally, it may be time to move on. Markets and the economy already have.
1 J.P. Morgan. June 9, 2025. https://advisor.zacksim.com/e/376582/c-outlook-jobs-report-may-2025/5t5cv8/1247316295/h/owGnC7fvD72gai2Bp4elWIlr-gFT_8pC8PvEKtYttho
2 Wall Street Journal. May 2, 2025.
3 Fred Economic Data. June 9, 2025. https://advisor.zacksim.com/e/376582/series-ADPWNUSNERSA-/5t5cvc/1247316295/h/owGnC7fvD72gai2Bp4elWIlr-gFT_8pC8PvEKtYttho
DISCLOSURE
Past performance is no guarantee of future results. Inherent in any investment is the potential for loss.
Zacks Investment Management, Inc. is a wholly-owned subsidiary of Zacks Investment Research. Zacks Investment Management is an independent Registered Investment Advisory firm and acts as an investment manager for individuals and institutions. Zacks Investment Research is a provider of earnings data and other financial data to institutions and to individuals.
This material is being provided for informational purposes only and nothing herein constitutes investment, legal, accounting or tax advice, or a recommendation to buy, sell or hold a security. Do not act or rely upon the information and advice given in this publication without seeking the services of competent and professional legal, tax, or accounting counsel. Publication and distribution of this article is not intended to create, and the information contained herein does not constitute, an attorney-client relationship. No recommendation or advice is being given as to whether any investment or strategy is suitable for a particular investor. It should not be assumed that any investments in securities, companies, sectors or markets identified and described were or will be profitable. All information is current as of the date of herein and is subject to change without notice. Any views or opinions expressed may not reflect those of the firm as a whole.
Any projections, targets, or estimates in this report are forward looking statements and are based on the firm’s research, analysis, and assumptions. Due to rapidly changing market conditions and the complexity of investment decisions, supplemental information and other sources may be required to make informed investment decisions based on your individual investment objectives and suitability specifications. All expressions of opinions are subject to change without notice. Clients should seek financial advice regarding the appropriateness of investing in any security or investment strategy discussed in this presentation.
Certain economic and market information contained herein has been obtained from published sources prepared by other parties. Zacks Investment Management does not assume any responsibility for the accuracy or completeness of such information. Further, no third party has assumed responsibility for independently verifying the information contained herein and accordingly no such persons make any representations with respect to the accuracy, completeness or reasonableness of the information provided herein. Unless otherwise indicated, market analysis and conclusions are based upon opinions or assumptions that Zacks Investment Management considers to be reasonable. Any investment inherently involves a high degree of risk, beyond any specific risks discussed herein.
The S&P 500 Index is a well-known, unmanaged index of the prices of 500 large-company common stocks, mainly blue-chip stocks, selected by Standard & Poor’s. The S&P 500 Index assumes reinvestment of dividends but does not reflect advisory fees. The volatility of the benchmark may be materially different from the individual performance obtained by a specific investor. An investor cannot invest directly in an index.
The Russell 1000 Growth Index is a well-known, unmanaged index of the prices of 1000 large-company growth common stocks selected by Russell. The Russell 1000 Growth Index assumes reinvestment of dividends but does not reflect advisory fees. An investor cannot invest directly in an index. The volatility of the benchmark may be materially different from the individual performance obtained by a specific investor.
Nasdaq Composite Index is the market capitalization-weighted index of over 3,300 common equities listed on the Nasdaq stock exchange. The types of securities in the index include American depositary receipts, common stocks, real estate investment trusts (REITs) and tracking stocks, as well as limited partnership interests. The index includes all Nasdaq-listed stocks that are not derivatives, preferred shares, funds, exchange-traded funds (ETFs) or debenture securities. An investor cannot invest directly in an index. The volatility of the benchmark may be materially different from the individual performance obtained by a specific investor.
The Dow Jones Industrial Average measures the daily stock market movements of 30 U.S. publicly-traded companies listed on the NASDAQ or the New York Stock Exchange (NYSE). The 30 publicly-owned companies are considered leaders in the United States economy. An investor cannot directly invest in an index. The volatility of the benchmark may be materially different from the individual performance obtained by a specific investor.
The Bloomberg Global Aggregate Index is a flagship measure of global investment grade debt from twenty-four local currency markets. This multi-currency benchmark includes treasury, government-related, corporate and securitized fixed-rate bonds from both developed and emerging markets issuers. An investor cannot invest directly in an index. The volatility of the benchmark may be materially different from the individual performance obtained by a specific investor.
The ICE Exchange-Listed Fixed & Adjustable Rate Preferred Securities Index is a modified market capitalization weighted index composed of preferred stock and securities that are functionally equivalent to preferred stock including, but not limited to, depositary preferred securities, perpetual subordinated debt and certain securities issued by banks and other financial institutions that are eligible for capital treatment with respect to such instruments akin to that received for issuance of straight preferred stock. An investor cannot invest directly in an index. The volatility of the benchmark may be materially different from the individual performance obtained by a specific investor.
The MSCI ACWI ex U.S. Index captures large and mid-cap representation across 22 of 23 Developed Markets (DM) countries (excluding the United States) and 24 Emerging Markets (EM) countries. The index covers approximately 85% of the global equity opportunity set outside the U.S. An investor cannot invest directly in an index. The volatility of the benchmark may be materially different from the individual performance obtained by a specific investor.
The Russell 2000 Index is a well-known, unmanaged index of the prices of 2000 small-cap company common stocks, selected by Russell. The Russell 2000 Index assumes reinvestment of dividends but does not reflect advisory fees. An investor cannot invest directly in an index. The volatility of the benchmark may be materially different from the individual performance obtained by a specific investor.
The S&P Mid Cap 400 provides investors with a benchmark for mid-sized companies. The index, which is distinct from the large-cap S&P 500, is designed to measure the performance of 400 mid-sized companies, reflecting the distinctive risk and return characteristics of this market segment.
The S&P 500 Pure Value index is a style-concentrated index designed to track the performance of stocks that exhibit the strongest value characteristics by using a style-attractiveness-weighting scheme. An investor cannot directly invest in an index. The volatility of the benchmark may be materially different from the individual performance obtained by a specific investor.