
Apart from the sharp selloff tied to the “Liberation Day” tariff announcement, U.S. stocks posted a banner year in 2025—largely driven by Technology stocks and the ongoing AI trade.
The strong performance has many investors concerned. The phrase “AI bubble” made the rounds in the second half of last year, with comparisons to the late 1990s tech boom becoming increasingly common. It’s a fair position to bring up for debate—valuations are elevated, enthusiasm is widespread, and capital spending tied to artificial intelligence is accelerating.1 Market bubbles happen when asset prices become untethered from underlying fundamentals, and importantly, from free cash flow. So the question for investors today is, have we reached that point in this cycle? To answer that question, it is useful to look back to the late 1990s to understand what other forces were at work in creating bubble-like conditions. In that period, we saw soaring valuations like we do now, but those valuations were also accompanied by dramatic economy-wide distortions: an unprecedented investment surge, declining corporate profitability, rising leverage, widening credit spreads, and growing financial imbalances that eventually helped tip the economy into recession.
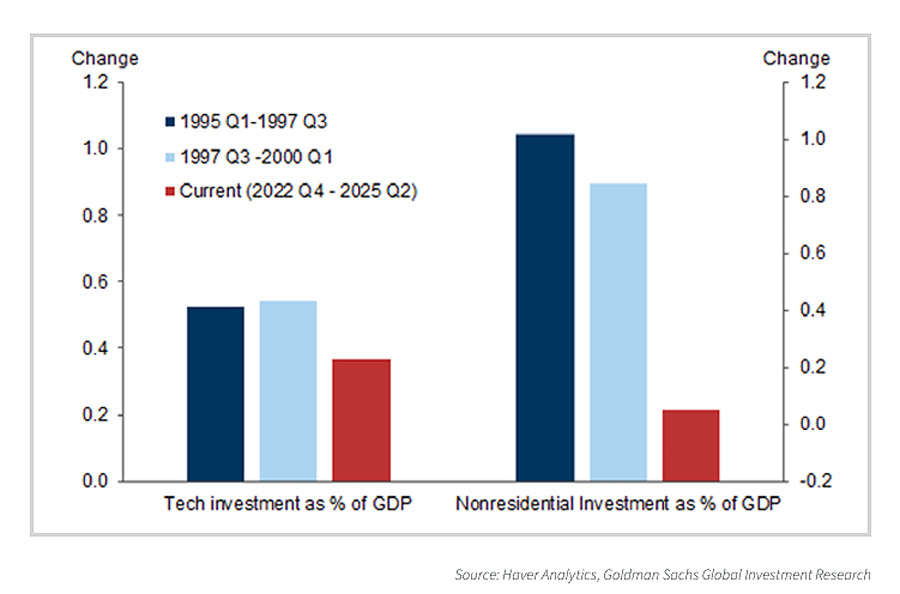
In our view, many of those warning signs are not yet visible today, but it’s important for investors to continue to look for them. Let’s start with the investment piece. Capital expenditures (business investment) from hyper-scalers have surged since generative AI went mainstream in late 2022, and AI-related investment is now a key component of total investment across the economy. But the scale and persistence of that spending remain well below what defined the late stages of the tech bubble. Relative to GDP, AI investment is smaller than the telecom and technology buildout of the late 1990s, and it has not yet been sustained for the multi-year stretch that ultimately proved destabilizing back then.
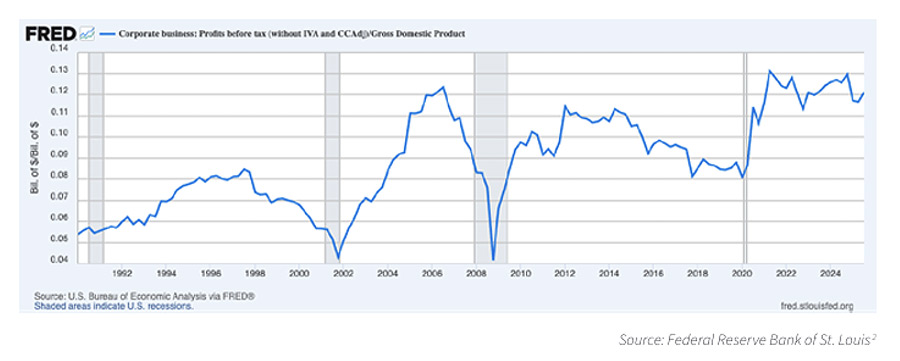
Profitability also tells an important story. In the 1990s, corporate profit margins peaked in late 1997 (see chart below) and then quietly eroded as wages rose and unit labor costs climbed. As corporate profitability fell, the Nasdaq continued to soar. Today, the opposite dynamic is in place. Corporate margins remain elevated, earnings growth has been resilient, and wage pressures have eased rather than intensified. Productivity growth has improved recently, though it is still too early to attribute most of that gain directly to AI. Crucially, there is no clear evidence yet that AI-related investment is undermining profitability at the macro level, as seen on the chart below.
Balance sheets further differentiate this cycle from the last one. During the tech bubble, investment increasingly relied on debt, pushing the corporate sector into financial deficit and weakening balance sheets. Today, most large AI-linked companies are funding expansion primarily through internal cash flows. Leverage has risen modestly, but from historically strong starting points, and the corporate sector as a whole remains in surplus.
1 Haver Analytics, Goldman Sachs Global Investment Research, November 9, 2025.
2 Fred Economic Data. December 23, 2025. https://fred.stlouisfed.org/series/A446RC1Q027SBEA
DISCLOSURE
Past performance is no guarantee of future results. Inherent in any investment is the potential for loss.
Zacks Investment Management, Inc. is a wholly-owned subsidiary of Zacks Investment Research. Zacks Investment Management is an independent Registered Investment Advisory firm and acts as an investment manager for individuals and institutions. Zacks Investment Research is a provider of earnings data and other financial data to institutions and to individuals.
This material is being provided for informational purposes only and nothing herein constitutes investment, legal, accounting or tax advice, or a recommendation to buy, sell or hold a security. Do not act or rely upon the information and advice given in this publication without seeking the services of competent and professional legal, tax, or accounting counsel. Publication and distribution of this article is not intended to create, and the information contained herein does not constitute, an attorney-client relationship. No recommendation or advice is being given as to whether any investment or strategy is suitable for a particular investor. It should not be assumed that any investments in securities, companies, sectors or markets identified and described were or will be profitable. All information is current as of the date of herein and is subject to change without notice. Any views or opinions expressed may not reflect those of the firm as a whole.
Any projections, targets, or estimates in this report are forward looking statements and are based on the firm’s research, analysis, and assumptions. Due to rapidly changing market conditions and the complexity of investment decisions, supplemental information and other sources may be required to make informed investment decisions based on your individual investment objectives and suitability specifications. All expressions of opinions are subject to change without notice. Clients should seek financial advice regarding the appropriateness of investing in any security or investment strategy discussed in this presentation.
Certain economic and market information contained herein has been obtained from published sources prepared by other parties. Zacks Investment Management does not assume any responsibility for the accuracy or completeness of such information. Further, no third party has assumed responsibility for independently verifying the information contained herein and accordingly no such persons make any representations with respect to the accuracy, completeness or reasonableness of the information provided herein. Unless otherwise indicated, market analysis and conclusions are based upon opinions or assumptions that Zacks Investment Management considers to be reasonable. Any investment inherently involves a high degree of risk, beyond any specific risks discussed herein.
The S&P 500 Index is a well-known, unmanaged index of the prices of 500 large-company common stocks, mainly blue-chip stocks, selected by Standard & Poor’s. The volatility of the benchmark may be materially different from the individual performance obtained by a specific investor. An investor cannot invest directly in an index. The S&P 500 Index assumes reinvestment of dividends but does not reflect advisory fees. The Russell 1000 Growth Index is a well-known, unmanaged index of the prices of 1000 large-company growth common stocks selected by Russell.
The Russell 1000 Growth Index assumes reinvestment of dividends but does not reflect advisory fees. An investor cannot invest directly in an index. The volatility of the benchmark may be materially different from the individual performance obtained by a specific investor.
Nasdaq Composite Index is the market capitalization-weighted index of over 3,300 common equities listed on the Nasdaq stock exchange. The types of securities in the index include American depositary receipts, common stocks, real estate investment trusts (REITs) and tracking stocks, as well as limited partnership interests. The index includes all Nasdaq-listed stocks that are not derivatives, preferred shares, funds, exchange-traded funds (ETFs) or debenture securities. An investor cannot invest directly in an index. The volatility of the benchmark may be materially different from the individual performance obtained by a specific investor.
The Dow Jones Industrial Average measures the daily stock market movements of 30 U.S. publicly-traded companies listed on the NASDAQ or the New York Stock Exchange (NYSE). The 30 publicly-owned companies are considered leaders in the United States economy. An investor cannot directly invest in an index. The volatility of the benchmark may be materially different from the individual performance obtained by a specific investor.
The Russell 2000 Index is a well-known, unmanaged index of the prices of 2000 small-cap company common stocks, selected by Russell. The Russell 2000 Index assumes reinvestment of dividends but does not reflect advisory fees. An investor cannot invest directly in an index. The volatility of the benchmark may be materially different from the individual performance obtained by a specific investor.
The FTSE 100 is a market-capitalisation weighted index of UK-listed blue chip companies. The index is part of the FTSE UK Series and is designed to measure the performance of the 100 largest companies traded on the London Stock Exchange that pass screening for size and liquidity. FTSE 100 constituents are all traded on the London Stock Exchange’s SETS trading system. An investor cannot invest directly in an index. The volatility of the benchmark may be materially different from the individual performance obtained by a specific investor.
The Nikkei Stock Average, the Nikkei 225 is used around the globe as the premier index of Japanese stocks. More than 60 years have passed since the commencement of its calculation, which represents the history of Japanese economy after the World War II. Because of the prominent nature of the index, many financial products linked to the Nikkei 225 have been created are traded worldwide while the index has been sufficiently used as the indicator of the movement of Japanese stock markets. The Nikkei 225 is a price-weighted equity index, which consists of 225 stocks in the 1st section of the Tokyo Stock Exchange. An investor cannot invest directly in an index. The volatility of the benchmark may be materially different from the individual performance obtained by a specific investor.
The Russell 1000 Value Index is a well-known, unmanaged index of the prices of 1000 large-company value common stocks selected by Russell. The Russell 1000 Value Index assumes reinvestment of dividends but does not reflect advisory fees. An investor cannot directly invest in an index. The volatility of the benchmark may be materially different from the individual performance obtained by a specific investor.
The Russell Midcap Index is a well-known, unmanaged index of the prices of approximately 800 mid-cap company common stocks, selected by Russell. The Russell Midcap Index assumes reinvestment of dividends but does not reflect advisory fees. An investor cannot invest directly in an index. The volatility of the benchmark may be materially different from the individual performance obtained by a specific investor.
DAX tracks the performance of the 40 largest companies listed on the Regulated Market of Frankfurter Wertpapierbörse (FWB, the Frankfurt Stock Exchange) that fulfil certain minimum quality and profitability requirements. Constituent selection is based on free float market capitalization. An investor cannot invest directly in an index.
The S&P Municipal Bond Index is a broad, market value-weighted index that seeks to measure the performance of the U.S. municipal bond market. An investor cannot invest directly in an index. The MSCI Emerging Markets Index captures large and mid cap representation across 24 Emerging Markets (EM) countries. The index covers approximately 85% of the free float-adjusted market capitalization in each country. An investor cannot invest directly in an index.
The S&P MidCap 400 provides investors with a benchmark for mid-sized companies. The index, which is distinct from the large-cap S&P 500, is designed to measure the performance of 400 mid-sized companies, reflecting the distinctive risk and return characteristics of this market segment. An investor cannot invest directly in an index. The volatility of the benchmark may be materially different from the individual performance obtained by a specific investor.
The S&P SmallCap 600 seeks to measure the small-cap segment of the U.S. equity market. The index is designed to track companies that meet specific inclusion criteria to ensure that they are liquid and financially viable. The volatility of the benchmark may be materially different from the individual performance obtained by a specific investor.
The CBOE Volatility Index (VIX) is a calculation designed to produce a measure of constant, 30-day expected volatility of the U.S. stock market, derived from real-time, mid-quote prices of S&P 500 Index call and put options. On a global basis, it is one of the most recognized measures of volatility — widely reported by financial media and closely followed by a variety of market participants as a daily market indicator. The volatility of the benchmark may be materially different from the individual performance obtained by a specific investor. An investor cannot invest directly in an index.
The S&P SmallCap 600 Value measures constituents from the S&P SmallCap 600 that are classified as value stocks based on three factors: the ratios of book value, earnings and sales to price. An investor cannot invest directly in an index.
The S&P SmallCap 600 Growth measures constituents from the S&P SmallCap 600 that are classified as growth stocks based on three factors: sales growth, the ratio of earnings change to price, and momentum. An investor cannot invest directly in an index. The Russell 2000 Value Index measures the performance of the smallcap value segment of the US equity universe. It includes those Russell 2000 companies with relatively lower price-to-book ratios, lower I/B/E/S forecast medium term (2 year) growth and lower sales per share historical growth (5 years).
The Russell 2000 Value Index is constructed to provide a comprehensive and unbiased barometer for the small-cap value segment. The index is completely reconstituted annually to ensure new and growing equities are included and that the represented companies continue to reflect value characteristics. The volatility of the benchmark may be materially different from the individual performance obtained by a specific investor.
The Russell 2000 Growth Index measures the performance of the smallcap growth segment of the US equity universe. It includes those Russell 2000 companies with relatively higher price-to-book ratios, higher I/B/E/S forecast medium term (2 year) growth and higher sales per share historical growth (5 years). The Russell 2000 Growth Index is constructed to provide a comprehensive and unbiased barometer for the small-cap growth segment. The index is completely reconstituted annually to ensure new and growing equities are included and that the represented companies continue to reflect growth characteristics. The volatility of the benchmark may be materially different from the individual performance obtained by a specific investor.
The MSCI United Kingdom Index is designed to measure the performance of the large and mid-cap segments of the UK market. The index covers approximately 85% of the free float-adjusted market capitalization in the UK. The volatility of the benchmark may be materially different from the individual performance obtained by a specific investor.
The MSCI Germany Index is designed to measure the performance of the large and mid-cap segments of the German market. The index covers about 85% of the equity universe in Germany. The volatility of the benchmark may be materially different from the individual performance obtained by a specific investor.
The MSCI Japan Index is designed to measure the performance of the large and mid-cap segments of the Japanese market. The index covers approximately 85% of the free float-adjusted market capitalization in Japan. The volatility of the benchmark may be materially different from the individual performance obtained by a specific investor.
The MSCI World Index captures large and mid-cap representation across 23 Developed Markets (DM) countries. The index covers approximately 85% of the free float-adjusted market capitalization in each country. The volatility of the benchmark may be materially different from the individual performance obtained by a specific investor.
The MSCI EAFE Index is an equity index which captures large and mid cap representation across 21 Developed Markets countries around the world, excluding the US and Canada. The index covers approximately 85% of the free float-adjusted market capitalization in each country. The volatility of the benchmark may be materially different from the individual performance obtained by a specific investor. An investor cannot invest directly in an index.