
Q2 2024 U.S. GDP Numbers Quiet the Naysayers
Underestimating the U.S. economy’s fundamental strength was a theme in 2023. At the outset of the year, nearly every polled economist predicted the U.S. would enter a recession as the Federal Reserve raised interest rates, with a stated goal of lifting the unemployment rate to tame inflation. Instead, the economy grew 3.1% for the year and added nearly 3 million new jobs.
Fast forward to 2024, and the U.S. economy still has its doubters. It is common to see the argument that the U.S. consumer is tapped out—pandemic savings are gone, people are increasingly frustrated by nominally higher prices, and households are weighed down by rising debt loads and high interest rates.¹
Yet the economy keeps chugging along.
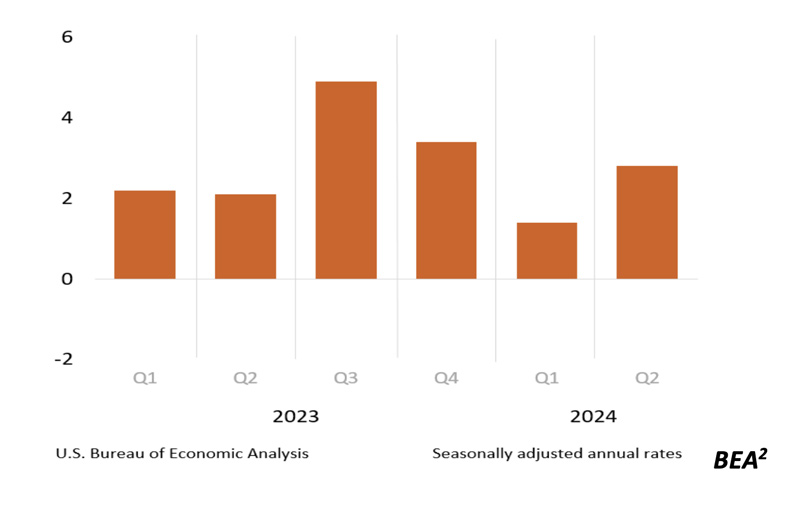
In the second quarter, the Commerce Department reported that the U.S. economy expanded at an annual rate of 2.8%, to a level of $22.9 trillion. That’s significantly more than the 2.1% rate economists had expected, and it also marks a significant acceleration from the 1.4% annual GDP growth rate posted in Q1 2024.
Real GDP Percent change from preceding quarter
From an investment perspective, the elements of GDP that matter most to stocks—private sector components and consumer spending, in my view—were solid nearly across the board.
Breaking these down, we saw businesses investing in commercial construction, equipment, and software at a stout 5.2% annualized rate, up from 4.4% in the last reporting period. Capital expenditures (capex) were driven by an 11.6% increase in spending on equipment and a nearly 5% increase in software/intellectual property investment, which in my view demonstrates that corporations are going on offense—not what you’d expect to see in a tenuous economic environment.
Capex Jumped in Q2 2024, as Businesses Invested in More Equipment and Software
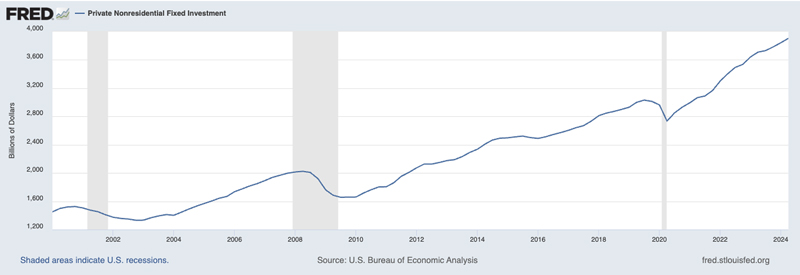
Source: Federal Reserve Bank of St. Louis³
U.S. consumers also had a good quarter, continuing a trend that has lasted years now.
Sometime in 2023, we started hearing about pandemic savings running dry, and pockets of weakness appearing in the labor market. More recently, I’ve seen warnings of rising delinquencies and consumers feeling squeezed by higher prices and the effects of higher borrowing costs. While much of this is true, it simply hasn’t translated into a consequential pullback in spending.
To be fair, solid consumer spending data in Q2 owes partially to a weak first quarter, when spending on goods fell -2.3% annualized. The base effect made a rebound in spending easily attainable, and consumers delivered. But if consumers are feeling pinched by the effects of high inflation and borrowing costs, there’s some positive news as it relates to the outlook from here: inflation continues to moderate, and I expect borrowing costs to move lower—not higher—in the next year.
To add, U.S. consumers continue to benefit from a steady labor market where wages (blue line in the chart) are rising at a faster-annualized pace than inflation (red line, CPI). These rising real wages give U.S. consumers more spending power in the face of inflation, not less.
Wages are Rising at a Faster Annual Pace than Inflation
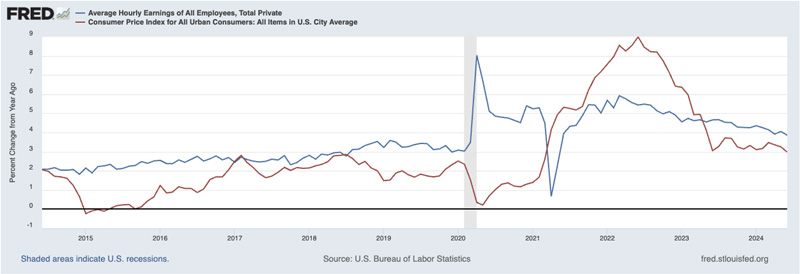
Source: Federal Reserve Bank of St. Louis⁴
Putting it all together, the odds of a “soft economic landing” keep going up, as economic growth continues apace while inflation continues to moderate. From an investment standpoint, that’s good news for stocks, in my view. But it could be especially positive for small caps.
With Fed funds currently between 5.25% and 5.5% and the latest inflation reading (according to the Fed’s preferred measure, the PCE price index) at 2.5%, monetary policy is quite restrictive. An outlook that interest rates will be lower in the future than they are today is a constructive setup for small-cap stocks.
Valuations should help this setup. Because large-cap growth stocks have had an impressive run especially relative to small-cap stocks, there’s a valuation gap that makes small-cap stocks look inexpensive on a relative basis. As of the end of Q2 2024, for instance, small-cap value stocks were trading at 96.7% of their 20-year average P/E, while large-cap growth stocks were trading at 149.2% of 20-year P/E averages. If rate cuts do come and the U.S. economy continues to surprise to the upside, small-caps could easily lead to the next phase of the bull market.
Bottom Line for Investors
I do not want to paint the picture that the U.S. economy is in perfect shape with few risks to growth. But I also think it is not accurate to frame the economy in doubtful terms or to say it is performing poorly, as many do. The second quarter GDP data—along with the past years’ worth of better-than-expected economic data—proves that the U.S. economy is still expanding solidly, despite higher interest rates. Stocks’ strong performance underscores as much.
Sources:
1) Wall Street Journal. July 25, 2024. https://advisor.zacksim.com/e/376582/onomy-trendingnow-article-pos3/5rgbvn/995489872/h/rzfemz5s5glno4BcDjR2i1bijQUtGYXxlVMBO0NUtUI
2) BEA. July 25, 2024. https://advisor.zacksim.com/e/376582/ata-gdp-gross-domestic-product/5rgbvr/995489872/h/rzfemz5s5glno4BcDjR2i1bijQUtGYXxlVMBO0NUtUI
3) Fred Economic Data.
4) Fred Economic Data. July 5, 2024. https://advisor.zacksim.com/e/376582/series-CES0500000003-/5rgbvv/995489872/h/rzfemz5s5glno4BcDjR2i1bijQUtGYXxlVMBO0NUtUI
DISCLOSURE
Past performance is no guarantee of future results. Inherent in any investment is the potential for loss.
Zacks Investment Management, Inc. is a wholly-owned subsidiary of Zacks Investment Research. Zacks Investment Management is an independent Registered Investment Advisory firm and acts as an investment manager for individuals and institutions. Zacks Investment Research is a provider of earnings data and other financial data to institutions and to individuals.
This material is being provided for informational purposes only and nothing herein constitutes investment, legal, accounting or tax advice, or a recommendation to buy, sell or hold a security. Do not act or rely upon the information and advice given in this publication without seeking the services of competent and professional legal, tax, or accounting counsel. Publication and distribution of this article is not intended to create, and the information contained herein does not constitute, an attorney-client relationship. No recommendation or advice is being given as to whether any investment or strategy is suitable for a particular investor. It should not be assumed that any investments in securities, companies, sectors or markets identified and described were or will be profitable. All information is current as of the date of herein and is subject to change without notice. Any views or opinions expressed may not reflect those of the firm as a whole.
Any projections, targets, or estimates in this report are forward looking statements and are based on the firm’s research, analysis, and assumptions. Due to rapidly changing market conditions and the complexity of investment decisions, supplemental information and other sources may be required to make informed investment decisions based on your individual investment objectives and suitability specifications. All expressions of opinions are subject to change without notice. Clients should seek financial advice regarding the appropriateness of investing in any security or investment strategy discussed in this presentation.
Certain economic and market information contained herein has been obtained from published sources prepared by other parties. Zacks Investment Management does not assume any responsibility for the accuracy or completeness of such information. Further, no third party has assumed responsibility for independently verifying the information contained herein and accordingly no such persons make any representations with respect to the accuracy, completeness or reasonableness of the information provided herein. Unless otherwise indicated, market analysis and conclusions are based upon opinions or assumptions that Zacks Investment Management considers to be reasonable. Any investment inherently involves a high degree of risk, beyond any specific risks discussed herein.
The S&P 500 Index is a well-known, unmanaged index of the prices of 500 large-company common stocks, mainly blue-chip stocks, selected by Standard & Poor’s. The S&P 500 Index assumes reinvestment of dividends but does not reflect advisory fees. The volatility of the benchmark may be materially different from the individual performance obtained by a specific investor. An investor cannot invest directly in an index.
The Russell 1000 Growth Index is a well-known, unmanaged index of the prices of 1000 large-company growth common stocks selected by Russell. The Russell 1000 Growth Index assumes reinvestment of dividends but does not reflect advisory fees. An investor cannot invest directly in an index. The volatility of the benchmark may be materially different from the individual performance obtained by a specific investor.
Nasdaq Composite Index is the market capitalization-weighted index of over 3,300 common equities listed on the Nasdaq stock exchange. The types of securities in the index include American depositary receipts, common stocks, real estate investment trusts (REITs) and tracking stocks, as well as limited partnership interests. The index includes all Nasdaq-listed stocks that are not derivatives, preferred shares, funds, exchange-traded funds (ETFs) or debenture securities. An investor cannot invest directly in an index. The volatility of the benchmark may be materially different from the individual performance obtained by a specific investor.
The Dow Jones Industrial Average measures the daily stock market movements of 30 U.S. publicly-traded companies listed on the NASDAQ or the New York Stock Exchange (NYSE). The 30 publicly-owned companies are considered leaders in the United States economy. An investor cannot directly invest in an index. The volatility of the benchmark may be materially different from the individual performance obtained by a specific investor.
The Bloomberg Global Aggregate Index is a flagship measure of global investment grade debt from twenty-four local currency markets. This multi-currency benchmark includes treasury, government-related, corporate and securitized fixed-rate bonds from both developed and emerging markets issuers. An investor cannot invest directly in an index. The volatility of the benchmark may be materially different from the individual performance obtained by a specific investor.
The ICE Exchange-Listed Fixed & Adjustable Rate Preferred Securities Index is a modified market capitalization weighted index composed of preferred stock and securities that are functionally equivalent to preferred stock including, but not limited to, depositary preferred securities, perpetual subordinated debt and certain securities issued by banks and other financial institutions that are eligible for capital treatment with respect to such instruments akin to that received for issuance of straight preferred stock. An investor cannot invest directly in an index. The volatility of the benchmark may be materially different from the individual performance obtained by a specific investor.
The MSCI ACWI ex U.S. Index captures large and mid-cap representation across 22 of 23 Developed Markets (DM) countries (excluding the United States) and 24 Emerging Markets (EM) countries. The index covers approximately 85% of the global equity opportunity set outside the U.S. An investor cannot invest directly in an index. The volatility of the benchmark may be materially different from the individual performance obtained by a specific investor.
The Russell 2000 Index is a well-known, unmanaged index of the prices of 2000 small-cap company common stocks, selected by Russell. The Russell 2000 Index assumes reinvestment of dividends but does not reflect advisory fees. An investor cannot invest directly in an index. The volatility of the benchmark may be materially different from the individual performance obtained by a specific investor.
The S&P Mid Cap 400 provides investors with a benchmark for mid-sized companies. The index, which is distinct from the large-cap S&P 500, is designed to measure the performance of 400 mid-sized companies, reflecting the distinctive risk and return characteristics of this market segment.
The S&P 500 Pure Value index is a style-concentrated index designed to track the performance of stocks that exhibit the strongest value characteristics by using a style-attractiveness-weighting scheme. An investor cannot directly invest in an index. The volatility of the benchmark may be materially different from the individual performance obtained by a specific investor.