
Bond Markets are Jittery – Should Investors Be Too?
Auctions for 20-year U.S. Treasuries are generally a routine, straightforward event that few investors pay much attention to.
That was not the case last week.
The auction for roughly $16 billion in 20-year debt featured unusually soft demand, with investors bidding up yields past 5%, well above the approximately 4.6% average seen in recent auctions. The 20-year bond joined 30-year Treasury yields above 5%, and the 10-year also continued to inch higher, crossing 4.6%. Stocks sold off sharply on the news.1
20-year and 30-Year U.S. Treasury Bond Yields Have Been Climbing Steadily
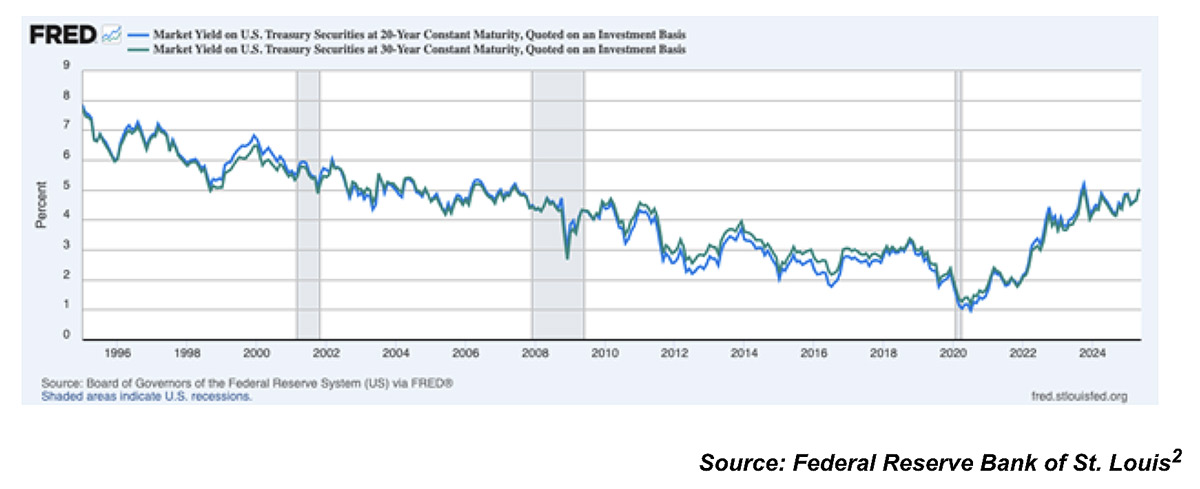
To be fair, these are not financial crisis-type moves in the bond markets, and there have been plenty of periods historically when yields are higher than they are now and the economy and stock market performed well. But it is correct to point out, in my view, that markets appear to be growing somewhat uncomfortable with the U.S.’s inflation and fiscal outlook.
In a past Mitch on the Markets column, I laid out three reasons why Treasury bond yields may move significantly higher:
- 1. Expectations for economic growth are going up, tied to expectations for pro-growth, pro-cyclical policies from the [current] administration.
- 2. Inflation expectations are going up, due to strong expected growth in an economy near full capacity or because of other factors, like trade policy (tariffs).
- 3. The bond market becomes increasingly concerned about fiscal health/sustainability, with growing deficits necessitating higher levels of bond issuance.
The concern is that yields are currently rising because of some combination of #2 and #3. The possibility of higher tariffs and higher government deficits (tied to the budget bill) aren’t helping.
Let’s start with the deficit issue. The starting point for the U.S. in 2025 is not great—the debt-to-GDP ratio is approaching a new all-time high, and the deficit relative to GDP is about 5% wider than it has historically been when the economy was at full employment. It is with this backdrop that “One, Big, Beautiful Bill” has passed the House of Representatives, which introduces tax cut extensions, new tax cuts, and spending provisions that are not fully paid for by cuts or new revenue. The implication is more annual budget deficits and additions to the national debt, which means more Treasury issuance. Yields are not likely to move lower in this scenario.
On the spending side, “One, Big, Beautiful Bill” introduces some spending cuts and measures like work requirements for Medicaid coverage, and the Department of Government Efficiency (DOGE) continues efforts to reduce government spending. But the scope of these spending cuts together is not likely to cover the cost of the tax cuts and annual government expenditures, which means shrinking the deficit is not likely. The Senate may demand more spending cuts in the bill, but the actual outcome remains to be seen. It’s understandable that bond markets are a bit wobbly in the meantime.
On the inflation side of the ledger, it is really all about whether tariffs remain in force, and for how long. In Trump’s first term, tariff threats were loud on the ‘bark’ but ultimately far more modest on the ‘bite.’ The tariffs that stuck were largely relegated to China, and corporations responded in many cases by rerouting trade through Vietnam and other intermediaries (including Mexico). U.S. markets and the economy did not feel much pain, and overall core inflation remained below 2% throughout this period.
We do not know where tariffs will end up for the wide variety of U.S. trading partners. But the baseline 10% universal tariff will arguably raise inflation at least moderately, perhaps to around 3% at the peak. Growth could also see an impact, given higher import costs and greater uncertainty. If Treasury yields go up in this case because of higher inflation and inflation expectations—without a corresponding acceleration in growth—that could trigger another correction in stocks, in my view.
Bottom Line for Investors
There’s still time. Tariffs, growing budget deficits, and sluggish economic growth are not foregone conclusions, and sharply rising bond yields aren’t either. We could see a breakthrough in trade deals, changes could be made to One, Big, Beautiful Bill to make it more budget neutral, and inflation could remain in check as the economy remains fundamentally strong. U.S. Treasury bond yields could remain in a trading range under these circumstances, and the Fed may even find cause to lower the fed funds rate and steepen the yield curve in the process.
In 2023, acute worries over too much debt and deficit spending faded as inflation came down and the economy grew, fueling the bull market in stocks and pulling in foreign investment. The door is open for this possibility in 2025, too.
1 Wall Street Journal. May 22, 2025. https://advisor.zacksim.com/e/376582/al-mess-in-washington-fcebd153/5t2vxb/1237912929/h/zpGCdFbX-oF19sjx8ZsTe4zrMB4i4WyP0yMDfChzOVI
2 Fred Economic Data. May 21, 2025. https://advisor.zacksim.com/e/376582/series-DGS20-/5t2vxf/1237912929/h/zpGCdFbX-oF19sjx8ZsTe4zrMB4i4WyP0yMDfChzOVI
DISCLOSURE
Past performance is no guarantee of future results. Inherent in any investment is the potential for loss.
Zacks Investment Management, Inc. is a wholly-owned subsidiary of Zacks Investment Research. Zacks Investment Management is an independent Registered Investment Advisory firm and acts as an investment manager for individuals and institutions. Zacks Investment Research is a provider of earnings data and other financial data to institutions and to individuals.
This material is being provided for informational purposes only and nothing herein constitutes investment, legal, accounting or tax advice, or a recommendation to buy, sell or hold a security. Do not act or rely upon the information and advice given in this publication without seeking the services of competent and professional legal, tax, or accounting counsel. Publication and distribution of this article is not intended to create, and the information contained herein does not constitute, an attorney-client relationship. No recommendation or advice is being given as to whether any investment or strategy is suitable for a particular investor. It should not be assumed that any investments in securities, companies, sectors or markets identified and described were or will be profitable. All information is current as of the date of herein and is subject to change without notice. Any views or opinions expressed may not reflect those of the firm as a whole.
Any projections, targets, or estimates in this report are forward looking statements and are based on the firm’s research, analysis, and assumptions. Due to rapidly changing market conditions and the complexity of investment decisions, supplemental information and other sources may be required to make informed investment decisions based on your individual investment objectives and suitability specifications. All expressions of opinions are subject to change without notice. Clients should seek financial advice regarding the appropriateness of investing in any security or investment strategy discussed in this presentation.
Certain economic and market information contained herein has been obtained from published sources prepared by other parties. Zacks Investment Management does not assume any responsibility for the accuracy or completeness of such information. Further, no third party has assumed responsibility for independently verifying the information contained herein and accordingly no such persons make any representations with respect to the accuracy, completeness or reasonableness of the information provided herein. Unless otherwise indicated, market analysis and conclusions are based upon opinions or assumptions that Zacks Investment Management considers to be reasonable. Any investment inherently involves a high degree of risk, beyond any specific risks discussed herein.
The S&P 500 Index is a well-known, unmanaged index of the prices of 500 large-company common stocks, mainly blue-chip stocks, selected by Standard & Poor’s. The S&P 500 Index assumes reinvestment of dividends but does not reflect advisory fees. The volatility of the benchmark may be materially different from the individual performance obtained by a specific investor. An investor cannot invest directly in an index.
The Russell 1000 Growth Index is a well-known, unmanaged index of the prices of 1000 large-company growth common stocks selected by Russell. The Russell 1000 Growth Index assumes reinvestment of dividends but does not reflect advisory fees. An investor cannot invest directly in an index. The volatility of the benchmark may be materially different from the individual performance obtained by a specific investor.
Nasdaq Composite Index is the market capitalization-weighted index of over 3,300 common equities listed on the Nasdaq stock exchange. The types of securities in the index include American depositary receipts, common stocks, real estate investment trusts (REITs) and tracking stocks, as well as limited partnership interests. The index includes all Nasdaq-listed stocks that are not derivatives, preferred shares, funds, exchange-traded funds (ETFs) or debenture securities. An investor cannot invest directly in an index. The volatility of the benchmark may be materially different from the individual performance obtained by a specific investor.
The Dow Jones Industrial Average measures the daily stock market movements of 30 U.S. publicly-traded companies listed on the NASDAQ or the New York Stock Exchange (NYSE). The 30 publicly-owned companies are considered leaders in the United States economy. An investor cannot directly invest in an index. The volatility of the benchmark may be materially different from the individual performance obtained by a specific investor.
The Bloomberg Global Aggregate Index is a flagship measure of global investment grade debt from twenty-four local currency markets. This multi-currency benchmark includes treasury, government-related, corporate and securitized fixed-rate bonds from both developed and emerging markets issuers. An investor cannot invest directly in an index. The volatility of the benchmark may be materially different from the individual performance obtained by a specific investor.
The ICE Exchange-Listed Fixed & Adjustable Rate Preferred Securities Index is a modified market capitalization weighted index composed of preferred stock and securities that are functionally equivalent to preferred stock including, but not limited to, depositary preferred securities, perpetual subordinated debt and certain securities issued by banks and other financial institutions that are eligible for capital treatment with respect to such instruments akin to that received for issuance of straight preferred stock. An investor cannot invest directly in an index. The volatility of the benchmark may be materially different from the individual performance obtained by a specific investor.
The MSCI ACWI ex U.S. Index captures large and mid-cap representation across 22 of 23 Developed Markets (DM) countries (excluding the United States) and 24 Emerging Markets (EM) countries. The index covers approximately 85% of the global equity opportunity set outside the U.S. An investor cannot invest directly in an index. The volatility of the benchmark may be materially different from the individual performance obtained by a specific investor.
The Russell 2000 Index is a well-known, unmanaged index of the prices of 2000 small-cap company common stocks, selected by Russell. The Russell 2000 Index assumes reinvestment of dividends but does not reflect advisory fees. An investor cannot invest directly in an index. The volatility of the benchmark may be materially different from the individual performance obtained by a specific investor.
The S&P Mid Cap 400 provides investors with a benchmark for mid-sized companies. The index, which is distinct from the large-cap S&P 500, is designed to measure the performance of 400 mid-sized companies, reflecting the distinctive risk and return characteristics of this market segment.
The S&P 500 Pure Value index is a style-concentrated index designed to track the performance of stocks that exhibit the strongest value characteristics by using a style-attractiveness-weighting scheme. An investor cannot directly invest in an index. The volatility of the benchmark may be materially different from the individual performance obtained by a specific investor.