All Posts By

BayTrust Financial

Mitch Zacks – Weekly Market Commentary: Why Equity Investors Are Actively Rotating Capital

By Weekly Market Commentary

A diversified portfolio of U.S. stocks has performed well over the past few years, but the ability to generate strong alpha has largely relied on being overweight by a few key names (most of which are in the “Magnificent Seven”).1

But this has not been the case in 2026.

As I write, the S&P 500 Equal Weight Index is outperforming the market-cap weighted S&P 500 Index by approximately 200 basis points year-to-date, which sends a clear signal that investors have been rotating capital away from the hottest trade.

We know this because the traditional S&P 500 is market-cap weighted, which means the largest companies (mega-cap tech stocks) have the greatest influence on performance. The equal-weight version gives every company the same weight. When the equal-weight index outperforms, it suggests the average stock is doing better than the headline index may indicate.

Put simply, many of “the other 493 stocks” in the index are quietly experiencing solid, sometimes bigger gains. This is a healthy development, and I think the reason comes down to three forces: earnings strength, fading uncertainty, and more selectivity within the AI trade.

Let’s start with earnings.

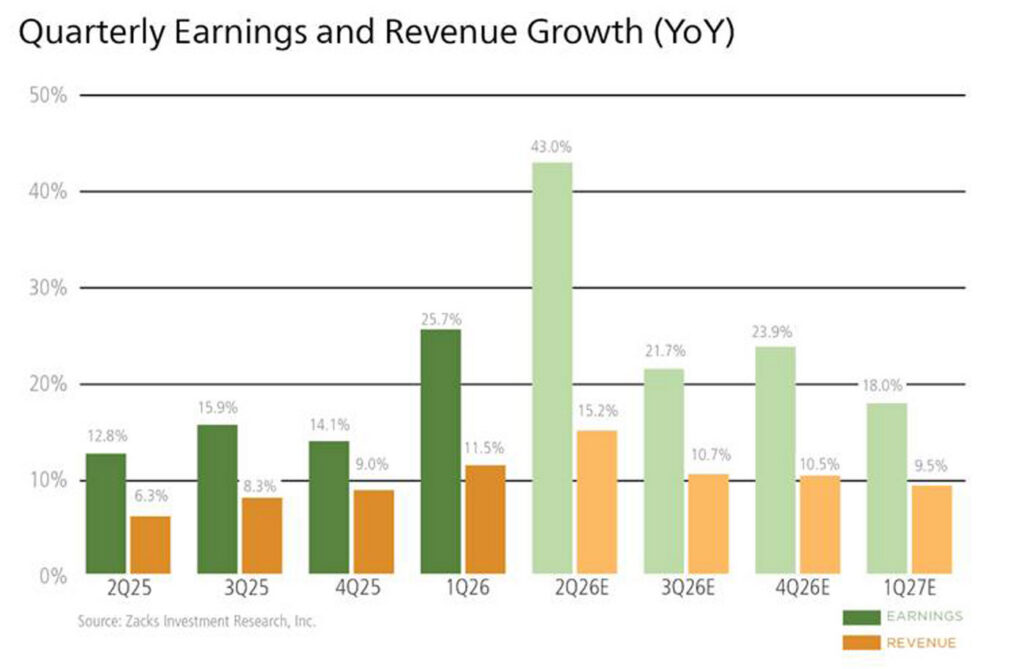
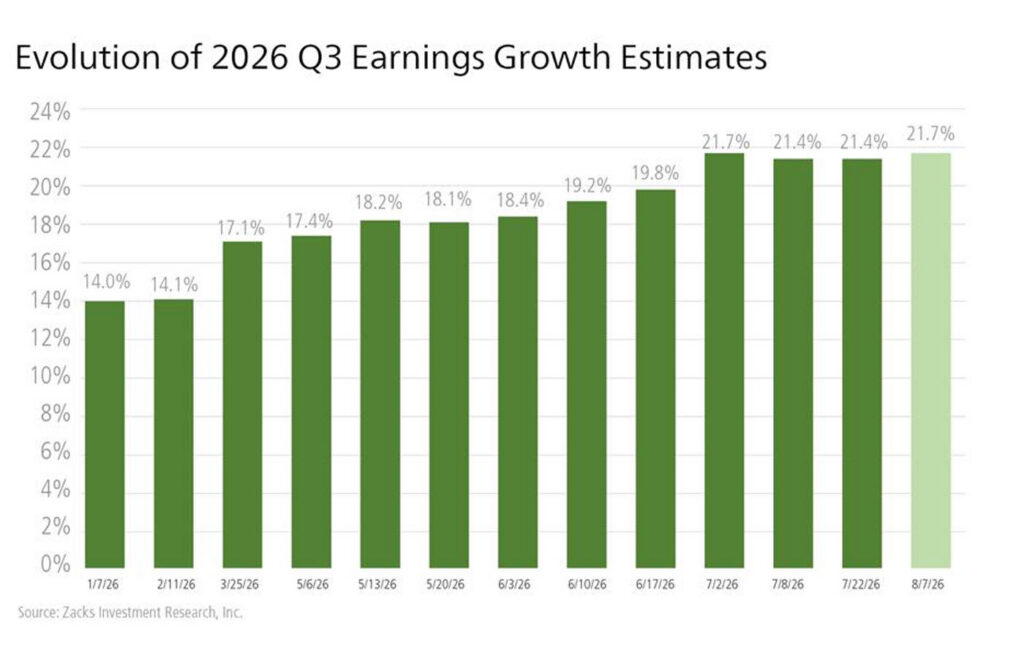
According to our colleagues at Zacks Investment Research, aggregate earnings for the S&P 500 grew +40.9% year-over-year on +14.5% higher revenues. Positive surprises were also widespread, with 83.8% beating EPS estimates and 76.9% topping revenue estimates.

To be fair, some of the headline earnings strength is still being driven by a few very large companies. But the earnings story does not disappear when those companies are removed. As seen on the nearby chart, if we exclude Technology sector earnings and a few key earnings drivers in Q2, we still get around 15% year-over-year earnings growth—a strong improvement from previous years.

Zacks2

The same point shows up within the Technology sector. Zacks data shows that Q2 earnings growth in the Tech sector remains heavily concentrated in Nvidia, Micron, and Alphabet. Stripping out those three companies reduces Q2 earnings growth for the rest of the Tech sector from +95.2% to +33.7%. Quite a revision, but still very strong overall.

The second force, I think, is driving the broadening is fading uncertainty. Market leadership often narrows when uncertainty is high, as investors tend to crowd into the companies and themes with the clearest earnings visibility, strongest balance sheets, or most durable growth. Over the last few years, that has clearly been mega-cap Technology and AI-linked stocks.

But in 2026, several major risks have become easier for markets to process. The war and oil price volatility are of course still front-and-center, but investors have had six months to gauge the impact on energy prices and corporate earnings. Similarly, tariff policy has returned to headlines, but the market has moved beyond the initial shock phase and is now assessing company-by-company exposure. The Fed’s outlook on interest rates may be the remaining wild card, but I think if we’re talking about 25 basis points in either direction, it’s not enough to factor as a negative surprise.

The final force is more selectivity within the AI trade. In July, AI-linked areas like semiconductors, memory, power, liquid cooling, and optical networking all came under pressure. When a trade becomes more volatile, investors often look for ways to reduce concentration and find opportunities elsewhere. And indeed, in August, the rebound became more differentiated, with investors rewarding some parts of the AI ecosystem more than others. That type of selectivity is healthier than simply buying the entire theme indiscriminately.

It has also meant investors are increasingly looking for earnings growth in sectors that were written off earlier in the year—which is how rotation often works. Companies and sectors that were overlooked earlier in the year are getting a second look as fundamentals improve and the macro backdrop becomes easier to assess. In my view, that is an important shift. A rally led by a handful of mega-cap stocks can work for a while, but a rally supported by more companies, more sectors, and more earnings drivers tends to be a healthier market environment.

Bottom Line for Investors

The U.S. stock market has not completely moved past the concentration issue. But the rally is becoming broader, as equal-weight outperformance, strong earnings growth outside a few headline names, and more participation across sectors all suggest the market has more support beneath the surface than many investors may realize.

For diversified investors, that is an encouraging signal. Diversification does not always feel valuable when leadership is narrow, but it becomes important when leadership changes—which is what we’ve seen in 2026 year-to-date.

Zacks. August 19, 2026. https://advisor.zacksim.com/e/376582/ergy-fuel-sp-500-growth-engine/5vtn75/1602110950/h/5YE_Y8p4MEGevotlIHe7ekn8jgFyHzIO9HRgP0zmzCM
2 Zacks. August 19, 2026. https://advisor.zacksim.com/e/376582/ergy-fuel-sp-500-growth-engine/5vtn75/1602110950/h/5YE_Y8p4MEGevotlIHe7ekn8jgFyHzIO9HRgP0zmzCM

DISCLOSURE

Past performance is no guarantee of future results. Inherent in any investment is the potential for loss.

Zacks Investment Management, Inc. is a wholly-owned subsidiary of Zacks Investment Research. Zacks Investment Management is an independent Registered Investment Advisory firm and acts as an investment manager for individuals and institutions. Zacks Investment Research is a provider of earnings data and other financial data to institutions and to individuals.

This material is being provided for informational purposes only and nothing herein constitutes investment, legal, accounting or tax advice, or a recommendation to buy, sell or hold a security. Do not act or rely upon the information and advice given in this publication without seeking the services of competent and professional legal, tax, or accounting counsel. Publication and distribution of this article is not intended to create, and the information contained herein does not constitute, an attorney-client relationship. No recommendation or advice is being given as to whether any investment or strategy is suitable for a particular investor. It should not be assumed that any investments in securities, companies, sectors or markets identified and described were or will be profitable. All information is current as of the date of herein and is subject to change without notice. Any views or opinions expressed may not reflect those of the firm as a whole.

Any projections, targets, or estimates in this report are forward looking statements and are based on the firm’s research, analysis, and assumptions. Due to rapidly changing market conditions and the complexity of investment decisions, supplemental information and other sources may be required to make informed investment decisions based on your individual investment objectives and suitability specifications. All expressions of opinions are subject to change without notice. Clients should seek financial advice regarding the appropriateness of investing in any security or investment strategy discussed in this presentation.

Certain economic and market information contained herein has been obtained from published sources prepared by other parties.  Zacks Investment Management does not assume any responsibility for the accuracy or completeness of such information. Further, no third party has assumed responsibility for independently verifying the information contained herein and accordingly no such persons make any representations with respect to the accuracy, completeness or reasonableness of the information provided herein. Unless otherwise indicated, market analysis and conclusions are based upon opinions or assumptions that Zacks Investment Management considers to be reasonable.

The S&P 500 Index is a well-known, unmanaged index of the prices of 500 large-company common stocks, mainly blue-chip stocks, selected by Standard & Poor’s. The S&P 500 Index assumes reinvestment of dividends but does not reflect advisory fees. The volatility of the benchmark may be materially different from the individual performance obtained by a specific investor. An investor cannot invest directly in an index.

The Nasdaq Composite Index measures all Nasdaq domestic and international based common type stocks listed on The Nasdaq Stock Market. To be eligible for inclusion in the Index, the security’s U.S. listing must be exclusively on The Nasdaq Stock Market (unless the security was dually listed on another U.S. market prior to January 1, 2004 and has continuously maintained such listing). The security types eligible for the Index include common stocks, ordinary shares, ADRs, shares of beneficial interest or limited partnership interests and tracking stocks. Security types not included in the Index are closed-end funds, convertible debentures, exchange traded funds, preferred stocks, rights, warrants, units and other derivative securities. An investor cannot invest directly in an index.

The PHLX Semiconductor Sector Index is designed to track the performance of a set of companies engaged in the design, distribution, manufacture, and sale of semiconductors. An investor cannot invest directly in an index. The volatility of the benchmark may be materially different from the individual performance obtained by a specific investor.

Questions posed are for demonstrative and informational purposes only and may not reflect the views of current clients or any one individual.

Any investment inherently involves a high degree of risk, beyond any specific risks discussed herein.

Mitch Zacks – Weekly Market Commentary: The Bond Market Is Sending a Message

By Weekly Market Commentary

Bond yields have moved higher in recent weeks, which has prompted a debate among market participants as to the potential cause: rising inflation expectations, market consternation at rising deficits in the U.S. and abroad, sinking global demand for Treasurys, or some combination of forces.1

10- and 30-Year U.S. Treasury Bond Yields, Year-to-Date

Source: Federal Reserve Bank of St. Louis2

Then, a surprise announcement last week by Treasury Secretary Scott Bessent sent the debate into overdrive.

Secretary Bessent announced plans to expand long-dated U.S. Treasury bond buybacks, with the U.S. Department of the Treasury at least doubling the size of certain buyback operations from $2 billion to $4 billion. The buybacks would focus on the long end of the curve—meaning 10- and 30-year U.S. Treasurys—with the move framed as an effort to support market functioning and liquidity.

But there seemed to be one glaring problem—there was no noticeable issue with liquidity or the ‘plumbing’ of Treasury markets. Treasury auctions were still clearing, dealers were not visibly pulling back, and the market was not facing the kind of forced selling we saw in March 2020. Markets took the news skeptically, and yields ultimately ticked higher—not lower.

I won’t go too deep into the weeds here, but the signal taken from markets was that the Department of the Treasury was intervening in bond markets not because of liquidity issues, but because of pricing issues. In other words, the actual goal was to put a support under bond prices, which equates to an effort to push yields lower, arguably in support of keeping borrowing rates low and financial conditions accommodative.

This was the story that was playing out in headlines last week, but I think it all lacked important context. A $4 billion buyback operation sounds large in isolation, especially after headlines emphasized that Treasury was “doubling” the size of certain operations. But scale is important here, as Treasury cash securities trade around $1 trillion per day in a roughly $32.2 trillion Treasury market. In that context, a $2 billion buyback increase is unlikely to materially change the market’s supply-demand balance on its own.

Rising long-term rates are usually framed as a negative, because they can raise borrowing costs, push mortgage rates higher, and weigh on stock valuations. All these outcomes are real and possible, but rising yields can also serve as an important market signal. When investors demand more compensation to lend for 10, 20, or 30 years, they may be sending a message about inflation, Treasury supply, fiscal policy, or uncertainty. In this sense, markets can ‘demand’ a certain discipline to push policymakers into difficult choices.

There is also a constructive side of the yield story that often gets overlooked.

First, higher yields mean investors are being paid more to own bonds over time. This yield compensation can come with price volatility, but it does improve the overall income profile of high-quality fixed income for long-term investors.

Second, a steeper yield, where long duration bonds see more upward pressure than the short end of the curve, can improve the economics of bank lending. Banks generally fund themselves at shorter-term rates and lend at longer-term rates. When long-term rates rise relative to short-term rates, lending can become more profitable. In the current context, loans and leases in bank credit for all commercial banks were up 7.3% year-over-year as of mid-August, arguably aided in part by rising long duration yields.

Ultimately, higher yields are not automatically positive or negative, but they do carry important information. If yields are rising because growth remains resilient, the economy and corporate earnings may be able to absorb some of the pressure. If yields are rising because inflation expectations or fiscal concerns are worsening, investors should take that signal seriously. For now, I don’t think the recent moves have been sharp enough to suggest a bond market in crisis. But they have been meaningful enough to remind investors that long-term rates, federal borrowing needs, and inflation expectations all deserve close attention.

Bottom Line for Investors

Rising long-term yields deserve attention, but they do not automatically point to a bond market crisis. They are a signal—about inflation, growth, Treasury supply, deficits, and the return investors require to lend money for longer periods.

The right response is not to react emotionally to every move in rates. It is to listen to what the bond market is saying, while keeping the message in perspective.

1 Wall Street Journal. August 21, 2026. https://advisor.zacksim.com/e/376582/mod-Searchresults-pos-5-page-1/5vsxd2/1594610707/h/tepFt_XVIUI0L2XHtmh5Z38sxYUoDnbS3usl92cRACE

Fred Economic Data. August 26, 2026. https://advisor.zacksim.com/e/376582/series-DGS10/5vsxd5/1594610707/h/tepFt_XVIUI0L2XHtmh5Z38sxYUoDnbS3usl92cRACE

DISCLOSURE

Past performance is no guarantee of future results. Inherent in any investment is the potential for loss.

Zacks Investment Management, Inc. is a wholly-owned subsidiary of Zacks Investment Research. Zacks Investment Management is an independent Registered Investment Advisory firm and acts as an investment manager for individuals and institutions. Zacks Investment Research is a provider of earnings data and other financial data to institutions and to individuals.

This material is being provided for informational purposes only and nothing herein constitutes investment, legal, accounting or tax advice, or a recommendation to buy, sell or hold a security. Do not act or rely upon the information and advice given in this publication without seeking the services of competent and professional legal, tax, or accounting counsel. Publication and distribution of this article is not intended to create, and the information contained herein does not constitute, an attorney-client relationship. No recommendation or advice is being given as to whether any investment or strategy is suitable for a particular investor. It should not be assumed that any investments in securities, companies, sectors or markets identified and described were or will be profitable. All information is current as of the date of herein and is subject to change without notice. Any views or opinions expressed may not reflect those of the firm as a whole.

Any projections, targets, or estimates in this report are forward looking statements and are based on the firm’s research, analysis, and assumptions. Due to rapidly changing market conditions and the complexity of investment decisions, supplemental information and other sources may be required to make informed investment decisions based on your individual investment objectives and suitability specifications. All expressions of opinions are subject to change without notice. Clients should seek financial advice regarding the appropriateness of investing in any security or investment strategy discussed in this presentation.

Certain economic and market information contained herein has been obtained from published sources prepared by other parties.  Zacks Investment Management does not assume any responsibility for the accuracy or completeness of such information. Further, no third party has assumed responsibility for independently verifying the information contained herein and accordingly no such persons make any representations with respect to the accuracy, completeness or reasonableness of the information provided herein. Unless otherwise indicated, market analysis and conclusions are based upon opinions or assumptions that Zacks Investment Management considers to be reasonable.

The S&P 500 Index is a well-known, unmanaged index of the prices of 500 large-company common stocks, mainly blue-chip stocks, selected by Standard & Poor’s. The S&P 500 Index assumes reinvestment of dividends but does not reflect advisory fees. The volatility of the benchmark may be materially different from the individual performance obtained by a specific investor. An investor cannot invest directly in an index.

The Nasdaq Composite Index measures all Nasdaq domestic and international based common type stocks listed on The Nasdaq Stock Market. To be eligible for inclusion in the Index, the security’s U.S. listing must be exclusively on The Nasdaq Stock Market (unless the security was dually listed on another U.S. market prior to January 1, 2004 and has continuously maintained such listing). The security types eligible for the Index include common stocks, ordinary shares, ADRs, shares of beneficial interest or limited partnership interests and tracking stocks. Security types not included in the Index are closed-end funds, convertible debentures, exchange traded funds, preferred stocks, rights, warrants, units and other derivative securities. An investor cannot invest directly in an index.

The PHLX Semiconductor Sector Index is designed to track the performance of a set of companies engaged in the design, distribution, manufacture, and sale of semiconductors. An investor cannot invest directly in an index. The volatility of the benchmark may be materially different from the individual performance obtained by a specific investor.

Questions posed are for demonstrative and informational purposes only and may not reflect the views of current clients or any one individual.

Any investment inherently involves a high degree of risk, beyond any specific risks discussed herein.

Mitch Zacks – Weekly Market Commentary: The Next “AI Concentration” Story May Be in the Bond Market

By Weekly Market Commentary

For years, investors have been warned about mega-cap tech concentration in the stock market. Readers have seen the statistics before—the “Magnificent Seven” stocks account for 30+% of the S&P 500 index, corporate earnings results are being pulled higher by a few key hyper-scalers, etc.1

But there is another concentration story developing in the capital markets that has received far less attention: the impact AI is having on credit markets.

In the early days of the AI investment frenzy, infrastructure was being funded primarily through free cash flow and equity markets. But as I take stock of the environment today, it’s clear that an increasing share of investment is coming from debt. Hyper-scalers and the broader AI ecosystem are issuing bonds to help finance data centers, chips, power infrastructure, cloud capacity, and other long-term investments tied to artificial intelligence.

The share of new investment-grade debt tied to AI has climbed quickly:

  • 2024: roughly 1% of year-to-date supply
  • 2025: roughly 7% of year-to-date supply
  • 2026: roughly 18% of year-to-date supply

Hyper-scalers issued roughly $108 billion of debt globally in 2025. So far in 2026, that figure has reached about $194 billion. Across the broader AI ecosystem, total AI-related debt issuance is estimated at nearly $500 billion year-to-date, with hyper-scalers accounting for about 40% of that total. In my view, this is starting to look like the credit-market parallel to what many investors already understand about equities.

In other words, this is not just a handful of large technology companies borrowing money. It is part of a much broader credit cycle tied to the AI buildout.

I want to pause here to make it clear that I do not think there is a leverage problem in the markets today. Many of the largest issuers remain highly rated, cash-generative, and in strong financial condition. The technology sector broadly entered this cycle with strong balance sheets and relatively low leverage, which gives many companies room to borrow for strategic investment. In many cases, AI-related borrowing is being used to build productive assets that companies believe will support future growth.​​​​

The trillion-dollar question, however, is: will the payout on AI be as high as the optimistic forecasts say it will be? Uncertainty about the answer will eventually place limits on investor demand for new debt.

For now, at least, there is no obvious sign that broad investment-grade credit markets are under major stress. Credit spreads have moved somewhat, but they remain low relative to periods of real market strain. Borrowers still have access to capital, and investor demand remains present.

Looking ahead, though, a multi-year wave of issuance can change the shape of a market. It can influence spreads, duration exposure, issuer concentration, and the terms investors require to absorb new supply. It can also pull in new structures—private credit, infrastructure funds, real estate lenders, and others. When a hot investment theme attracts large pools of capital, the risk is that lenders begin stretching terms, accepting weaker protections, or underestimating how difficult it may be to exit if conditions change.

As more AI financing moves into leases, project finance, infrastructure lending, and private credit structures, investors may have a harder time judging how much risk is building and where it ultimately sits. I’ve written before about cracks showing up in private credit markets, so this will be a story to continue watching.

The same principle applies to fixed income more broadly. Bonds are often discussed as if they are one asset class, but there are major differences between Treasurys, municipal bonds, investment-grade corporates, high-yield bonds, private credit, and structured finance. Each has a different role in a portfolio, and each carries different risks.

For investors, the AI credit story is another reminder that diversification matters in fixed income too. A portfolio can benefit from exposure to high-quality corporate bonds, but that does not mean investors should ignore issuer concentration, duration, credit quality, or the purpose of the borrowing. Investment-grade corporates can add income, but they still require careful credit selection.​​​​​​

Bottom Line for Investors

The AI credit story I’m telling here is not a warning that the largest technology companies are suddenly overleveraged. Most still have strong earnings, solid balance sheets, and ample access to capital. The bigger issue for investors, in my view, is exposure. The same AI theme that has created concentration concerns in equity markets is now showing up in credit markets, through bond issuance, data-center financing, lease commitments, and private-market structures that may be harder for investors to fully see.

The takeaway is that fixed income should not be treated as a passive endeavor for yield. It requires active oversight, credit discipline, and diversification across Treasurys, municipals, and high-quality corporates.

Goldman Sachs. 2026.

DISCLOSURE
Past performance is no guarantee of future results. Inherent in any investment is the potential for loss.

Zacks Investment Management, Inc. is a wholly-owned subsidiary of Zacks Investment Research. Zacks Investment Management is an independent Registered Investment Advisory firm and acts as an investment manager for individuals and institutions. Zacks Investment Research is a provider of earnings data and other financial data to institutions and to individuals.

This material is being provided for informational purposes only and nothing herein constitutes investment, legal, accounting or tax advice, or a recommendation to buy, sell or hold a security. Do not act or rely upon the information and advice given in this publication without seeking the services of competent and professional legal, tax, or accounting counsel. Publication and distribution of this article is not intended to create, and the information contained herein does not constitute, an attorney-client relationship. No recommendation or advice is being given as to whether any investment or strategy is suitable for a particular investor. It should not be assumed that any investments in securities, companies, sectors or markets identified and described were or will be profitable. All information is current as of the date of herein and is subject to change without notice. Any views or opinions expressed may not reflect those of the firm as a whole.

Any projections, targets, or estimates in this report are forward looking statements and are based on the firm’s research, analysis, and assumptions. Due to rapidly changing market conditions and the complexity of investment decisions, supplemental information and other sources may be required to make informed investment decisions based on your individual investment objectives and suitability specifications. All expressions of opinions are subject to change without notice. Clients should seek financial advice regarding the appropriateness of investing in any security or investment strategy discussed in this presentation.

Certain economic and market information contained herein has been obtained from published sources prepared by other parties.  Zacks Investment Management does not assume any responsibility for the accuracy or completeness of such information. Further, no third party has assumed responsibility for independently verifying the information contained herein and accordingly no such persons make any representations with respect to the accuracy, completeness or reasonableness of the information provided herein. Unless otherwise indicated, market analysis and conclusions are based upon opinions or assumptions that Zacks Investment Management considers to be reasonable.

The S&P 500 Index is a well-known, unmanaged index of the prices of 500 large-company common stocks, mainly blue-chip stocks, selected by Standard & Poor’s. The S&P 500 Index assumes reinvestment of dividends but does not reflect advisory fees. The volatility of the benchmark may be materially different from the individual performance obtained by a specific investor. An investor cannot invest directly in an index.

The Nasdaq Composite Index measures all Nasdaq domestic and international based common type stocks listed on The Nasdaq Stock Market. To be eligible for inclusion in the Index, the security’s U.S. listing must be exclusively on The Nasdaq Stock Market (unless the security was dually listed on another U.S. market prior to January 1, 2004 and has continuously maintained such listing). The security types eligible for the Index include common stocks, ordinary shares, ADRs, shares of beneficial interest or limited partnership interests and tracking stocks. Security types not included in the Index are closed-end funds, convertible debentures, exchange traded funds, preferred stocks, rights, warrants, units and other derivative securities. An investor cannot invest directly in an index.

The PHLX Semiconductor Sector Index is designed to track the performance of a set of companies engaged in the design, distribution, manufacture, and sale of semiconductors. An investor cannot invest directly in an index. The volatility of the benchmark may be materially different from the individual performance obtained by a specific investor.

Questions posed are for demonstrative and informational purposes only and may not reflect the views of current clients or any one individual.

Any investment inherently involves a high degree of risk, beyond any specific risks discussed herein.

Mitch Zacks – Weekly Market Commentary: Is This Market Too Hot? The Data Says No.

By Weekly Market Commentary

Many investors are looking at the current market rally and wondering if it is sustainable. If you’re a retiree, the concern may run even deeper, as your natural focus is on preserving gains, avoiding major drawdowns, and making sure your portfolio can support long-term income needs.

To put it another way: when stocks move higher in a hurry, it is reasonable to ask whether the market has moved too far, too fast.

The only real way to answer the question is to look at the earnings and economic fundamentals, in my view. Market volatility, which I often remind readers can move stocks in both directions, is driven by sentiment in the short run, but over time, earnings, economic growth, business investment, and consumer demand matter far more. If that’s the criteria we use to evaluate the current market, the rally looks to me like it has fundamental support.

The clearest tailwind is coming from corporate earnings.

Through August 7, 444 S&P 500 companies had reported Q2 results, representing nearly 89% of the index’s membership. For those companies, earnings were up 42.2% from the same period last year on 14.8% higher revenues. That’s not a misprint—42.2% year-over-year earnings growth! The beat rates were also strong, with 82.7% of companies exceeding earnings estimates and 76.4% topping revenue expectations.

Zacks1

To be fair, the headline earnings growth rate is getting a major boost from a few large companies. Alphabet’s Q2 results included a sizable non-operating unrealized gain tied to its SpaceX stake, and companies like Nvidia and Micron continue to have an outsized impact on the Technology sector’s growth rate. But the broader earnings picture still looks constructive even after accounting for that concentration. According to our colleagues at Zacks Investment Research, total S&P 500 earnings are expected to rise 27.1% in 2026. Excluding the Technology sector, earnings are still expected to increase 14.6%—a solid showing that I think speaks to broad economic strength.

The U.S. GDP data tells a similar story. Headline Q2 real GDP growth slowed to 1.5% annualized from 2.1% in Q1, which may seem fairly “muddle-through” for an economic growth rate. But underneath the headline figure, private-sector components were stronger than many appreciate, and I tend to think these data matter more than government spending and imports/exports, for instance.

The private sector components—consumer spending, business investment, and residential investment—grew at a 3.3% annualized pace, the strongest reading in more than three years. Personal consumption expenditures rose 3.2% annualized after increasing just 0.5% in Q1, and durable goods spending climbed 6.8%. Business investment also remained strong, with capital spending up 8.4% annualized after a 10.6% gain in Q1. These are strong prints across the board.

It’s not all big growth and expansion, however. July payrolls fell by -23,000, missing expectations for a gain. But a meaningful part of the July decline appears to have come from local government employment, while private employers still added 30,000 jobs. That is soft, to be sure, but it is not the same as broad labor market deterioration. Monthly jobs data can also be choppy and subject to revision, so the key is whether weakness persists. It’s something to watch in the months ahead.

Bottom Line for Investors

Strong rallies can make investors nervous, especially when they happen quickly and when leadership appears concentrated in a handful of large companies. But I’d argue the current market advance has not been built on sentiment alone.

The data are giving investors a reasonable explanation for the market’s strength. Corporate earnings are growing, revenues are rising, business investment remains healthy, and the economy continues to expand. Earnings expectations continue to move higher, too, which speaks to the corporate outlook.

The AI buildout may be difficult to fully grasp, but it is showing up in real spending, real revenue, and real earnings power. And that’s what matters to stocks.

© Zacks Investment Management  |  Privacy Policy
Zacks.com. August 7, 2026. https://advisor.zacksim.com/e/376582/s-validate-market-fundamentals/5vrgvb/1585478856/h/Qf3MCWDl1bjP_ce9YNWQWZyava0xOf9QAQYDzLhlusQ 

DISCLOSURE
Past performance is no guarantee of future results. Inherent in any investment is the potential for loss.

Zacks Investment Management, Inc. is a wholly-owned subsidiary of Zacks Investment Research. Zacks Investment Management is an independent Registered Investment Advisory firm and acts as an investment manager for individuals and institutions. Zacks Investment Research is a provider of earnings data and other financial data to institutions and to individuals.

This material is being provided for informational purposes only and nothing herein constitutes investment, legal, accounting or tax advice, or a recommendation to buy, sell or hold a security. Do not act or rely upon the information and advice given in this publication without seeking the services of competent and professional legal, tax, or accounting counsel. Publication and distribution of this article is not intended to create, and the information contained herein does not constitute, an attorney-client relationship. No recommendation or advice is being given as to whether any investment or strategy is suitable for a particular investor. It should not be assumed that any investments in securities, companies, sectors or markets identified and described were or will be profitable. All information is current as of the date of herein and is subject to change without notice. Any views or opinions expressed may not reflect those of the firm as a whole.

Any projections, targets, or estimates in this report are forward looking statements and are based on the firm’s research, analysis, and assumptions. Due to rapidly changing market conditions and the complexity of investment decisions, supplemental information and other sources may be required to make informed investment decisions based on your individual investment objectives and suitability specifications. All expressions of opinions are subject to change without notice. Clients should seek financial advice regarding the appropriateness of investing in any security or investment strategy discussed in this presentation.

Certain economic and market information contained herein has been obtained from published sources prepared by other parties.  Zacks Investment Management does not assume any responsibility for the accuracy or completeness of such information. Further, no third party has assumed responsibility for independently verifying the information contained herein and accordingly no such persons make any representations with respect to the accuracy, completeness or reasonableness of the information provided herein. Unless otherwise indicated, market analysis and conclusions are based upon opinions or assumptions that Zacks Investment Management considers to be reasonable.

The S&P 500 Index is a well-known, unmanaged index of the prices of 500 large-company common stocks, mainly blue-chip stocks, selected by Standard & Poor’s. The S&P 500 Index assumes reinvestment of dividends but does not reflect advisory fees. The volatility of the benchmark may be materially different from the individual performance obtained by a specific investor. An investor cannot invest directly in an index.

The Nasdaq Composite Index measures all Nasdaq domestic and international based common type stocks listed on The Nasdaq Stock Market. To be eligible for inclusion in the Index, the security’s U.S. listing must be exclusively on The Nasdaq Stock Market (unless the security was dually listed on another U.S. market prior to January 1, 2004 and has continuously maintained such listing). The security types eligible for the Index include common stocks, ordinary shares, ADRs, shares of beneficial interest or limited partnership interests and tracking stocks. Security types not included in the Index are closed-end funds, convertible debentures, exchange traded funds, preferred stocks, rights, warrants, units and other derivative securities. An investor cannot invest directly in an index.

The PHLX Semiconductor Sector Index is designed to track the performance of a set of companies engaged in the design, distribution, manufacture, and sale of semiconductors. An investor cannot invest directly in an index. The volatility of the benchmark may be materially different from the individual performance obtained by a specific investor.

Questions posed are for demonstrative and informational purposes only and may not reflect the views of current clients or any one individual.

Any investment inherently involves a high degree of risk, beyond any specific risks discussed herein.

Mitch Zacks – Weekly Market Commentary: What a Hedge Fund Blowup Says About Tech Volatility

By Weekly Market Commentary

The past few weeks have marked a volatile stretch for technology stocks—in both directions.

In July, several AI-related sub-sectors like semiconductors, memory, chips, and AI infrastructure came under intense selling pressure. The Philadelphia Semiconductor Index, for instance, nearly entered bear market territory in July, with every member of the index trading below its 50-day moving average.

Readers may have also seen stories on SK Hynix, which embodied the scale of the volatility. The company had just completed a blockbuster Nasdaq debut, raising more than $26 billion. But shares plunged -15% in one day even after a record-breaking earnings report, with operating profit up more than 500% year-over-year. The news stories and accompanying sharp moves in select stocks were head-spinning.

Investors were also concerned with Google’s Q2 earnings, which had the company posting its first negative free cash flow period since becoming public. Google remains highly profitable and deeply embedded in the AI race, but the market’s reaction showed that investors are paying closer attention to the cost of staying competitive in AI, not just the potential upside.

Which brings me to the Situational Awareness story. For readers who aren’t familiar, Situational Awareness ‘was’ the hedge fund founded by a former OpenAI researcher with no previous investment experience. The fund reportedly grew from hundreds of millions of dollars to a peak of approximately $45 billion in assets in less than two years, helped by a highly concentrated bet on the AI buildout.

The strategy was characterized as “long hardware, short software,” but it was a case study in the perils of becoming over-concentrated in a hot corner of the market and using leverage to juice the bet. In brief, the fund held sizable long positions in companies tied to AI infrastructure, chips, data centers, and power demand, while shorting software companies viewed as vulnerable to AI disruption. It was a concentrated expression of a view many investors have debated: that AI infrastructure would be the biggest near-term beneficiary of the technology wave, while some incumbent software businesses could face pressure.

But in July, both sides of the trade came under pressure at once. AI-infrastructure longs fell sharply, while some software shorts rallied. That meant the portfolio was not hedged in the way investors might expect from a long/short strategy. The long positions lost money, the short positions also lost money, and leverage turned the reversal into a liquidity event.

What happened next was astonishing. Situational Awareness’ assets fell from a peak of roughly $45 billion to about $10 billion in a matter of weeks. Its portfolio value reportedly declined 67% in July, forcing the fund to sell public equity holdings, eliminate leverage, and retain primarily private investments.

It marked a loud, wild cautionary tale about the risks of trying to predict exactly how the AI story will unfold—and using too much leverage and concentration to make that bet.

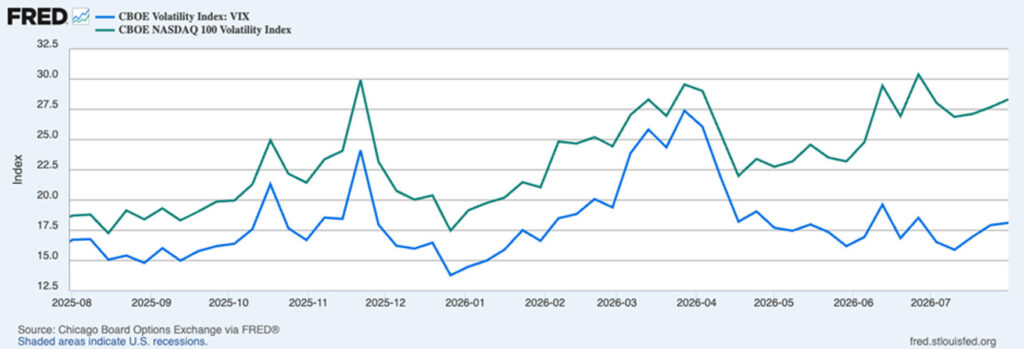
The point I want to make in this week’s column is that the Situational Awareness story—and July’s broader tech volatility—was not just about one fund, one company, or one trade. In fact, investors who were not following the day-to-day action closely may have looked at the broader market and assumed conditions were relatively normal. As the chart below shows, comparing the broad Volatility Index (VIX) to the Nasdaq 100 Volatility Index, broader market volatility was contained while volatility in the Nasdaq 100 was running much hotter.

Source: Federal Reserve Bank of St. Louis2

This is where diversification shows its value. Short-term noise can feel overwhelming when investors are concentrated in the part of the market generating the most headlines. But in a broader portfolio, those moves are only one part of the picture. In July, the S&P 500 was roughly flat, while sectors like Energy and Financials posted solid gains. Capital was rotating, not disappearing.

Diversification is not just about reducing exposure to volatility. It is about maintaining exposure to different sources of return when leadership shifts, so that portfolio returns can smooth out over time. Investors do not need every position, sector, or theme to generate blowout returns to make progress toward their long-term goals.

Bottom Line for Investors

The recent volatility in Tech does not negate the long-term opportunity in AI, semiconductors, software, or innovation more broadly. But it does show how difficult it can be to predict which part of a powerful theme will lead next, and it should remind investors how quickly leadership can shift.

For most investors, the goal is not to capture every upside move in the hottest corner of the market. It is to participate in long-term growth while managing the risk of being too dependent on one theme, one trade, or one moment in time. That is where diversification remains so valuable.

References to individual companies are for illustrative purposes only and should not be interpreted as recommendations to buy, sell, or hold any security.

1Wall Street Journal. July 31, 2026. https://advisor.zacksim.com/e/376582/eness-hedge-fund-imploded-html/5vqmlk/1581299065/h/ILfcWPfeQmsBoYmEmVDhR_dz6nqcAz8KMASdt_zb_YU

2 Fred Economic Data. August 5, 2026. https://advisor.zacksim.com/e/376582/series-VIXCLS/5vqmln/1581299065/h/ILfcWPfeQmsBoYmEmVDhR_dz6nqcAz8KMASdt_zb_YU

DISCLOSURE

Past performance is no guarantee of future results. Inherent in any investment is the potential for loss.

Zacks Investment Management, Inc. is a wholly-owned subsidiary of Zacks Investment Research. Zacks Investment Management is an independent Registered Investment Advisory firm and acts as an investment manager for individuals and institutions. Zacks Investment Research is a provider of earnings data and other financial data to institutions and to individuals.

This material is being provided for informational purposes only and nothing herein constitutes investment, legal, accounting or tax advice, or a recommendation to buy, sell or hold a security. Do not act or rely upon the information and advice given in this publication without seeking the services of competent and professional legal, tax, or accounting counsel. Publication and distribution of this article is not intended to create, and the information contained herein does not constitute, an attorney-client relationship. No recommendation or advice is being given as to whether any investment or strategy is suitable for a particular investor. It should not be assumed that any investments in securities, companies, sectors or markets identified and described were or will be profitable. All information is current as of the date of herein and is subject to change without notice. Any views or opinions expressed may not reflect those of the firm as a whole.

Any projections, targets, or estimates in this report are forward looking statements and are based on the firm’s research, analysis, and assumptions. Due to rapidly changing market conditions and the complexity of investment decisions, supplemental information and other sources may be required to make informed investment decisions based on your individual investment objectives and suitability specifications. All expressions of opinions are subject to change without notice. Clients should seek financial advice regarding the appropriateness of investing in any security or investment strategy discussed in this presentation.

Certain economic and market information contained herein has been obtained from published sources prepared by other parties. Zacks Investment Management does not assume any responsibility for the accuracy or completeness of such information. Further, no third party has assumed responsibility for independently verifying the information contained herein and accordingly no such persons make any representations with respect to the accuracy, completeness or reasonableness of the information provided herein. Unless otherwise indicated, market analysis and conclusions are based upon opinions or assumptions that Zacks Investment Management considers to be reasonable.

​The S&P 500 Index is a well-known, unmanaged index of the prices of 500 large-company common stocks, mainly blue-chip stocks, selected by Standard & Poor’s. The S&P 500 Index assumes reinvestment of dividends but does not reflect advisory fees. The volatility of the benchmark may be materially different from the individual performance obtained by a specific investor. An investor cannot invest directly in an index.

The Nasdaq Composite Index measures all Nasdaq domestic and international based common type stocks listed on The Nasdaq Stock Market. To be eligible for inclusion in the Index, the security’s U.S. listing must be exclusively on The Nasdaq Stock Market (unless the security was dually listed on another U.S. market prior to January 1, 2004 and has continuously maintained such listing). The security types eligible for the Index include common stocks, ordinary shares, ADRs, shares of beneficial interest or limited partnership interests and tracking stocks. Security types not included in the Index are closed-end funds, convertible debentures, exchange traded funds, preferred stocks, rights, warrants, units and other derivative securities. An investor cannot invest directly in an index.

The PHLX Semiconductor Sector Index is designed to track the performance of a set of companies engaged in the design, distribution, manufacture, and sale of semiconductors. An investor cannot invest directly in an index. The volatility of the benchmark may be materially different from the individual performance obtained by a specific investor.

Questions posed are for demonstrative and informational purposes only and may not reflect the views of current clients or any one individual.

Any investment inherently involves a high degree of risk, beyond any specific risks discussed herein.

Mitch Zacks – Weekly Market Commentary: Why New Tariffs and War May Not Have Much Market Impact

By Weekly Market Commentary

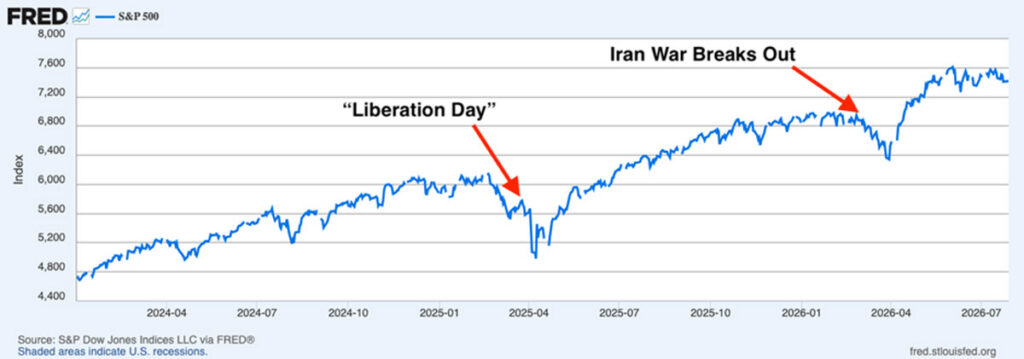
On April 2, 2025 (“Liberation Day”), the Trump administration announced sweeping, ‘reciprocal’ tariffs, and readers likely recall that the initial market reaction was swift and negative. Investors immediately tried to price in worst-case scenarios like higher import costs, pressure on profit margins, slower growth, renewed inflation, and a more complicated path for interest rates.

The conflict involving Iran followed a similar pattern. The initial reaction was sharp, with the S&P 500 nearly reaching correction territory in March. In that instance, investors were pricing-in fears about energy supply, inflation, and higher interest rates.

In both cases, the short-term market reaction was driven by uncertainty, understandably. But we now know that the longer-term response was driven by fundamentals, which remained strong despite these pressures. The S&P 500 rose nearly 18% in 2025 and gained another 10% in the first half of 2026.

The S&P 500 Absorbed Tariff and War Shocks Quickly, Then Continued to Rise (2024 – Present)

Source: Federal Reserve Bank of St. Louis 1

As we enter the second half of 2026, the tariff and war risks are back on the table, with one difference: the market has already spent the past year pricing, testing, and reassessing both risks in real time.

On the tariff side, we’ve seen an additional 50% tariff on a range of Canadian goods, including wine, alcoholic beverages, hockey sticks, cement, and other products. This comes on top of a broader tariff stack that includes duties on Chinese goods, non-USMCA Mexican products, European Union goods, semiconductors, and a proposed tariff (10% – 12.5%) tied to forced-labor concerns across dozens of countries.

I continue to believe that tariffs are not positive for the economy, as they raise costs, create uncertainty for businesses, and can pressure margins for companies with global supply chains or limited pricing power. But they are also no longer a brand-new shock.

When tariffs were first announced in 2025, investors had to consider a wide range of unknowns. Would companies pass the cost on to consumers? Would inflation reaccelerate? Would profit margins compress? Would trade partners retaliate in a way that disrupted global growth?

Investors now know the answers to most of those questions, with the bottom line being that corporate earnings proved more resilient than many feared. The result was not painless, but it also was not the market-breaking event many feared when the policy was first announced.

The renewed conflict involving Iran is similar. It remains a near-term risk because of its potential effects on energy supply, inflation, and interest rates. Earlier this year, investors entered the quarter with oil prices sharply higher and uncertainty surrounding transit through the Strait of Hormuz. But as the quarter progressed, the most severe market assumptions receded. Brent crude fell nearly 40% from its April peak, and oil exports from the Persian Gulf recovered to approximately 60% of their pre-war level.

With the conflict back on, Brent crude is near $90 per barrel, and Gulf transit has become volatile again, with some July days seeing only a fraction of normal vessel traffic through the Strait of Hormuz. While this is not a risk investors should dismiss, the market has seen this pattern before: escalation pushes oil prices higher, inflation expectations rise, bond yields tick higher, and investors reduce expectations for monetary easing. But when energy flows stabilize, much of that pricing can reverse quickly.

The potential consequences of renewed conflict are serious, but the channels through which it affects the economy are increasingly well understood. The same is true for tariffs. Both can still create volatility, but they likely need to worsen, broaden, or surprise markets in a new way to create lasting damage. And I don’t see that happening here.

Bottom Line for Investors

Tariffs and war are not good news, and neither should be ignored. Both can affect prices, margins, interest rates, energy markets, and investor confidence.

But these are no longer entirely new risks. Investors have already seen both issues play out in real time, and the worst-case, long-term market assumptions did not materialize. Volatility remains a distinct possibility, sure. But in my view, unless tariffs or the Iran conflict produce a new and more damaging economic surprise, the more important drivers for investors are still likely to be economic and corporate earnings fundamentals—both of which remain strong.

Fred Economic Data. July 28, 2026. https://advisor.zacksim.com/e/376582/series-SP500/5vpynx/1578235974/h/5Zltz33BeMCqHvx_Ik1Tyq9iDVVxJDUEvueQEc0_ENs

DISCLOSURE
Past performance is no guarantee of future results. Inherent in any investment is the potential for loss.

Zacks Investment Management, Inc. is a wholly-owned subsidiary of Zacks Investment Research. Zacks Investment Management is an independent Registered Investment Advisory firm and acts as an investment manager for individuals and institutions. Zacks Investment Research is a provider of earnings data and other financial data to institutions and to individuals.

This material is being provided for informational purposes only and nothing herein constitutes investment, legal, accounting or tax advice, or a recommendation to buy, sell or hold a security. Do not act or rely upon the information and advice given in this publication without seeking the services of competent and professional legal, tax, or accounting counsel. Publication and distribution of this article is not intended to create, and the information contained herein does not constitute, an attorney-client relationship. No recommendation or advice is being given as to whether any investment or strategy is suitable for a particular investor. It should not be assumed that any investments in securities, companies, sectors or markets identified and described were or will be profitable. All information is current as of the date of herein and is subject to change without notice. Any views or opinions expressed may not reflect those of the firm as a whole.

Any projections, targets, or estimates in this report are forward looking statements and are based on the firm’s research, analysis, and assumptions. Due to rapidly changing market conditions and the complexity of investment decisions, supplemental information and other sources may be required to make informed investment decisions based on your individual investment objectives and suitability specifications. All expressions of opinions are subject to change without notice. Clients should seek financial advice regarding the appropriateness of investing in any security or investment strategy discussed in this presentation.

Certain economic and market information contained herein has been obtained from published sources prepared by other parties. Zacks Investment Management does not assume any responsibility for the accuracy or completeness of such information. Further, no third party has assumed responsibility for independently verifying the information contained herein and accordingly no such persons make any representations with respect to the accuracy, completeness or reasonableness of the information provided herein. Unless otherwise indicated, market analysis and conclusions are based upon opinions or assumptions that Zacks Investment Management considers to be reasonable.

​The S&P 500 Index is a well-known, unmanaged index of the prices of 500 large-company common stocks, mainly blue-chip stocks, selected by Standard & Poor’s. The S&P 500 Index assumes reinvestment of dividends but does not reflect advisory fees. The volatility of the benchmark may be materially different from the individual performance obtained by a specific investor. An investor cannot invest directly in an index.

The Nasdaq Composite Index measures all Nasdaq domestic and international based common type stocks listed on The Nasdaq Stock Market. To be eligible for inclusion in the Index, the security’s U.S. listing must be exclusively on The Nasdaq Stock Market (unless the security was dually listed on another U.S. market prior to January 1, 2004 and has continuously maintained such listing). The security types eligible for the Index include common stocks, ordinary shares, ADRs, shares of beneficial interest or limited partnership interests and tracking stocks. Security types not included in the Index are closed-end funds, convertible debentures, exchange traded funds, preferred stocks, rights, warrants, units and other derivative securities. An investor cannot invest directly in an index.

The PHLX Semiconductor Sector Index is designed to track the performance of a set of companies engaged in the design, distribution, manufacture, and sale of semiconductors. An investor cannot invest directly in an index. The volatility of the benchmark may be materially different from the individual performance obtained by a specific investor.

Questions posed are for demonstrative and informational purposes only and may not reflect the views of current clients or any one individual.

Any investment inherently involves a high degree of risk, beyond any specific risks discussed herein.


Copyright © 2026. All rights reserved.
Mitch Zacks – Weekly Market Commentary: With Households Feeling Pressure, why is the Stock Market Booming?

By Weekly Market Commentary

According to the widely watched University of Michigan Consumer Sentiment Index, Americans are not feeling good about the economy. The index fell to 44.8 in May, down from 49.8 in April, marking the lowest reading in the survey’s history dating back to 1952. That means consumer attitudes are now weaker than they were during the 2008 financial crisis, the pandemic recession, the inflation surge of 2022, and the recessions of the 1970s.1

And yet the stock market is trading near all-time highs, having rallied off the lows at the start of the Iran conflict. For many investors, it can be puzzling to understand how a disconnect so large can exist.2

The answer, in my view, is simple and has been consistent throughout history: how consumers feel is not always the same as what consumers do.

Even as consumers report having negative feelings about the economy and financial situations, spending has remained quite firm. Retail sales rose 0.5% in April to $757.1 billion—in line with expectations—and following a stronger 1.6% gain in March. Some of the March increase was tied to higher gasoline prices, and there were signs of cooling in categories like furniture, where sales fell 2% in April after rising 2.6% in March. The detailed read on the data does not suggest consumers are retrenching. It suggests they are becoming more selective.

There’s also the matter of the “K-shaped economy” readers may hear about a lot in the news. The premise is that higher-income households continue spending at a healthy pace, supported by wages, asset values, and stronger balance sheets, while lowerincome households are under more pressure from higher prices.

Data from the New York Fed helps illustrate the split. Since early 2023, real retail spending among households earning more than $125,000 has risen about 7.6%, compared with roughly 3% for middle-income households and just over 1% for lowerincome households. That is a meaningful gap, and it explains why some retailers and service providers continue reporting strong demand while others see consumers becoming more cautious. Even still, however, we’re observing that consumers at all income levels are not pulling back entirely. They are trading down, choosing cheaper brands, prioritizing essentials, and looking for value.

The “K-shaped” argument has some merit, but I think its actual impact can be overstated at times. Higher-income households have always represented a large share of total spending, and lower-income consumers have not disappeared from the economy. The story is less about two completely separate economies and more about different degrees of pressure.

As for consumer sentiment surveys, it’s important for investors to remember that these indicators often reflect what households have already experienced, which in this case involves higher prices from 2022-2023, market volatility, political uncertainty, and more recently, gas price spikes. Markets, by contrast, tend to focus on whether economic reality is better or worse than expectations. When expectations are very low, as they are now, the bar for a positive surprise is also very low. It’s an easy hurdle for markets to overcome.

Not only is consumer spending holding up better than the sentiment surveys suggest, we’re also seeing solid business investment activity and of course, near-record earnings growth.

With nearly all S&P 500 companies reporting first-quarter results as I write, about 83% have beaten earnings expectations, which is the highest beat rate since 2021. Earnings strength has also broadened beyond the AI-related technology complex, with Energy, Materials, Industrials, Communication Services, and Consumer Discretionary companies contributing to better-than-expected results. In this context, negative consumer sentiment may actually be a key component of the constructive setup for markets. It’s part of the wall of worry markets love to climb.

Bottom Line for Investors

To be fair, the U.S. consumer is under pressure, especially from high prices in everyday categories. But pressure has not been resulting in retrenchment, at least not to date. Spending remains positive, higher-income households continue to support aggregate demand, and lower-income consumers appear to be adjusting rather than retreating entirely.

For markets, the key question is not whether consumers feel good. It is whether spending, earnings, and investment hold up better than today’s low expectations imply. So far, they have.

1 Wall Street Journal. May 28, 2026. https://www.wsj.com/economy/q1-gross-domestic-product-revisione1a6ff93?mod=economy_lead_story

2 Fred Economic Data. May 28, 2026. https://fred.stlouisfed.org/series/CP

3 MSN. 2026. https://www.msn.com/en-us/money/savingandinvesting/us-companies-shamed-by-trump-tiptoe-into-a-tariff-refundrace/ar-AA23ThNr

4 Wall Street Journal. May 24, 2026. https://www.wsj.com/economy/teen-summer-jobs-f3ffdbfa?mod=economy_lead_pos4

DISCLOSURE
Past performance is no guarantee of future results. Inherent in any investment is the potential for loss.

Zacks Investment Management, Inc. is a wholly-owned subsidiary of Zacks Investment Research. Zacks Investment Management is an independent Registered Investment Advisory firm and acts as an investment manager for individuals and institutions. Zacks Investment Research is a provider of earnings data and other financial data to institutions and to individuals.

This material is being provided for informational purposes only and nothing herein constitutes investment, legal, accounting or tax advice, or a recommendation to buy, sell or hold a security. Do not act or rely upon the information and advice given in this publication without seeking the services of competent and professional legal, tax, or accounting counsel. Publication and distribution of this article is not intended to create, and the information contained herein does not constitute, an attorney-client relationship. No recommendation or advice is being given as to whether any investment or strategy is suitable for a particular investor. It should not be assumed that any investments in securities, companies, sectors or markets identified and described were or will be profitable. All information is current as of the date of herein and is subject to change without notice. Any views or opinions expressed may not reflect those of the firm as a whole.

Any projections, targets, or estimates in this report are forward looking statements and are based on the firm’s research, analysis, and assumptions. Due to rapidly changing market conditions and the complexity of investment decisions, supplemental information and other sources may be required to make informed investment decisions based on your individual investment objectives and suitability specifications. All expressions of opinions are subject to change without notice. Clients should seek financial advice regarding the appropriateness of investing in any security or investment strategy discussed in this presentation.

Certain economic and market information contained herein has been obtained from published sources prepared by other parties. Zacks Investment Management does not assume any responsibility for the accuracy or completeness of such information. Further, no third party has assumed responsibility for independently verifying the information contained herein and accordingly no such persons make any representations with respect to the accuracy, completeness or reasonableness of the information provided herein. Unless otherwise indicated, market analysis and conclusions are based upon opinions or assumptions that Zacks Investment Management considers to be reasonable.

Any investment inherently involves a high degree of risk, beyond any specific risks discussed herein.

It is not possible to invest directly in an index. Investors pursuing a strategy similar to an index may experience higher or lower returns, which will be reduced by fees and expenses.

The ICE U.S. Dollar Index measures the value of the U.S. Dollar against a basket of currencies of the top six trading partners of the United States, as measured in 1973: the Euro zone, Japan, the United Kingdom, Canada, Sweden, and Switzerland. An investor cannot directly invest in an index. The volatility of the benchmark may be materially different from the individual performance obtained by a specific investor.

Zacks Investment Management, Inc. is a wholly-owned subsidiary of Zacks Investment Research. Zacks Investment Management is an independent Registered Investment Advisory firm that acts as an investment manager for individuals and institutions. Zacks Investment Research is a provider of earnings data and other financial data to institutions and to individuals.

This material is being provided for informational purposes only and nothing herein constitutes investment, legal, accounting or tax advice, or a recommendation to buy, sell or hold a security. Do not act or rely upon the information and advice given in this publication without seeking the services of competent and professional legal, tax, or accounting counsel. Publication and distribution of this article is not intended to create, and the information contained herein does not constitute, an attorney-client relationship. No recommendation or advice is being given as to whether any investment or strategy is suitable for a particular investor. It should not be assumed that any investments in securities, companies, sectors or markets identified and described were or will be profitable. All information is current as of the date of herein and is subject to change without notice. Any views or opinions expressed may not reflect those of the firm as a whole.

Any projections, targets, or estimates in this report are forward looking statements and are based on the firm’s research, analysis, and assumptions. Due to rapidly changing market conditions and the complexity of investment decisions, supplemental information and other sources may be required to make informed investment decisions based on your individual investment objectives and suitability specifications. All expressions of opinions are subject to change without notice. Clients should seek financial advice regarding the appropriateness of investing in any security or investment strategy discussed in this presentation.

Certain economic and market information contained herein has been obtained from published sources prepared by other parties. Zacks Investment Management does not assume any responsibility for the accuracy or completeness of such information. Further, no third party has assumed responsibility for independently verifying the information contained herein and accordingly no such persons make any representations with respect to the accuracy, completeness or reasonableness of the information provided herein. Unless otherwise indicated, market analysis and conclusions are based upon opinions or assumptions that Zacks Investment Management considers to be reasonable. Any investment inherently involves a high degree of risk, beyond any specific risks discussed herein.

The S&P 500 Index is a well-known, unmanaged index of the prices of 500 large-company common stocks, mainly blue-chip stocks, selected by Standard & Poor’s. The S&P 500 Index assumes reinvestment of dividends but does not reflect advisory fees. The volatility of the benchmark may be materially different from the individual performance obtained by a specific investor. An investor cannot invest directly in an index. The Russell 1000 Growth Index is a well-known, unmanaged index of the prices of 1000 large-company growth common stocks selected by Russell.

The Russell 1000 Growth Index assumes reinvestment of dividends but does not reflect advisory fees. An investor cannot invest directly in an index. The volatility of the benchmark may be materially different from the individual performance obtained by a specific investor.

Nasdaq Composite Index is the market capitalization-weighted index of over 3,300 common equities listed on the Nasdaq stock exchange. The types of securities in the index include American depositary receipts, common stocks, real estate investment trusts (REITs) and tracking stocks, as well as limited partnership interests. The index includes all Nasdaq-listed stocks that are not derivatives, preferred shares, funds, exchange-traded funds (ETFs) or debenture securities. An investor cannot invest directly in an index. The volatility of the benchmark may be materially different from the individual performance obtained by a specific investor.

The Dow Jones Industrial Average measures the daily stock market movements of 30 U.S. publicly-traded companies listed on the NASDAQ or the New York Stock Exchange (NYSE). The 30 publicly-owned companies are considered leaders in the United States economy. An investor cannot directly invest in an index. The volatility of the benchmark may be materially different from the individual performance obtained by a specific investor.

The Bloomberg Global Aggregate Index is a flagship measure of global investment grade debt from twenty-four local currency markets. This multi-currency benchmark includes treasury, government-related, corporate and securitized fixed-rate bonds from both developed and emerging markets issuers. An investor cannot invest directly in an index. The volatility of the benchmark may be materially different from the individual performance obtained by a specific investor.

The ICE Exchange-Listed Fixed & Adjustable Rate Preferred Securities Index is a modified market capitalization weighted index composed of preferred stock and securities that are functionally equivalent to preferred stock including, but not limited to, depositary preferred securities, perpetual subordinated debt and certain securities issued by banks and other financial institutions that are eligible for capital treatment with respect to such instruments akin to that received for issuance of straight preferred stock. An investor cannot invest directly in an index. The volatility of the benchmark may be materially different from the individual performance obtained by a specific investor.

The CBOE Volatility Index (VIX) is a calculation designed to produce a measure of constant, 30-day expected volatility of the U.S. stock market, derived from real-time, mid-quote prices of S&P 500 Index call and put options. On a global basis, it is one of the most recognized measures of volatility — widely reported by financial media and closely followed by a variety of market participants as a daily market indicator. The volatility of the benchmark may be materially different from the individual performance obtained by a specific investor. An investor cannot invest directly in an index. The NASDAQ-100 Index includes 100 of the largest domestic and international non-financial companies listed on The NASDAQ Stock Market based on market capitalization. The Index reflects companies across major industry groups including computer hardware and software, telecommunications, retail/wholesale trade and biotechnology. Index composition is reviewed on an annual basis in December. An investor cannot invest directly in an index.

Mitch Zacks – Weekly Market Commentary: What Bank Lending Data Reveals About Risk and Opportunity in Today’s Market

By Weekly Market Commentary

Commercial and industrial lending by U.S. banks surged 12.7% in the first quarter, the fastest pace of growth since 2022. I think there are fundamental and regulatory reasons bank lending is growing, which is what I mean by “opportunity” in today’s market. I’ll explain more below.

But the “risk” piece of the equation might be the more insightful part of the story, given that bank lending is growing as private credit is pulling back.1

Indeed, as bank lending expanded in Q1, private credit lending volumes fell 14% year-over-year. Fundraising for private credit vehicles has also fallen sharply, with new capital raised by non-listed business development companies (BDCs) down roughly 60% from a year ago. Investors also redeemed more than $15 billion from those funds during the quarter, contributing to a meaningful slowdown in new loan activity.

To give readers some background, private credit has become one of the fastest-growing corners of the financial system over the past decade. Private credit funds have filled a gap created by tighter post-financial crisis regulation, which made banks less willing to extend riskier corporate loans. In a relatively short period of time, private credit grew into a roughly $1.8 trillion market and has become an important source of financing for middle-market companies, leveraged buyouts, and private equity-backed transactions.

Yields from private credit vehicles have been attractive to investors in recent years, but these investments typically involve higher fees, less transparency, and more limited liquidity than traditional public securities—as I’ve written before. Shares may only be redeemable at certain intervals, withdrawals can be capped when demand is high, and reported values may not adjust as quickly as public market prices. Many investors who were not fully aware of these terms have been caught off guard recently.

There has been some chatter in financial media that cracks in private credit markets could potentially lead to contagion of some kind, or even a recession. But that’s not an argument I would make right now, especially given the bank lending data I cited above. Commercial banks dwarf the private credit market in size, with U.S. banks currently holding roughly $13.7 trillion in loans outstanding. That’s more than seven times the size of the private credit industry. Even modest increases in bank lending can therefore have a much larger impact on overall credit availability than declines in private lending volumes.

Which brings me to the “opportunity” in today’s market. Banks are benefiting from modest regulatory easing that is allowing them to compete more aggressively for leveraged loans and other corporate financing opportunities. Earlier this year, the Office of the Comptroller of the Currency indicated it was open to relaxing some post-crisis leveraged lending constraints in an effort to help banks regain market share from private lenders.

At the same time, banks may simply be in a stronger position to lend than they were in recent years. A steeper yield curve has improved lending economics, while deposit bases provide banks with cheaper funding than many private credit firms currently enjoy. In March, syndicated bank loans were being issued at spreads roughly 100 basis points lower than comparable private credit loans.

I would argue that this trend, if it holds, is just better for the economy and markets generally. Traditional bank lending generally operates within a more transparent and heavily regulated framework than large portions of the private credit universe. While some worry that easier lending standards could eventually encourage excessive risktaking, the broader takeaway today is that credit continues flowing through the financial system rather than contracting.

Ultimately, it’s credit that helps fund business expansion, acquisitions, capital investment, and hiring. If one corner of the lending market slows while another accelerates, the net economic impact may be far less negative than some of the recent private credit headlines imply. In that sense, what we may be witnessing is less a deterioration in credit conditions and more a shifting balance between private lenders and traditional banks.

Bottom Line for Investors

Companies borrow to expand operations, finance acquisitions, invest in equipment, and hire workers. While we’re seeing a decline in private credit coincide with a pickup in bank lending, that may ultimately be beside the point. Credit availability—not the specific source of the loan—is often the more important driver of future business investment and economic growth.

And right now, the broader lending backdrop still appears constructive. Bank lending is accelerating, corporate default rates remain relatively contained, and businesses continue to access capital despite growing caution in parts of the private credit market.

1 Bloomberg. May 18, 2026. https://finance.yahoo.com/economy/policy/articles/global-bond-yields-multiyear-highs-100607393.html

2 Fred Economic Data. May 20, 2026. https://fred.stlouisfed.org/series/DGS10

3 Goldman Sachs. May 20, 2026. https://www.goldmansachs.com/insights/articles/us-data-center-power-demand-projected-to-doubleby-2027

4 Wall Street Journal. May 20, 2026. https://www.wsj.com/economy/central-banking/fed-minutes-reveal-support-for-rate-hikes-ifinflation-proves-persistent-97e63b1c?mod=economy_lead_story

DISCLOSURE
Past performance is no guarantee of future results. Inherent in any investment is the potential for loss.

Zacks Investment Management, Inc. is a wholly-owned subsidiary of Zacks Investment Research. Zacks Investment Management is an independent Registered Investment Advisory firm and acts as an investment manager for individuals and institutions. Zacks Investment Research is a provider of earnings data and other financial data to institutions and to individuals.

This material is being provided for informational purposes only and nothing herein constitutes investment, legal, accounting or tax advice, or a recommendation to buy, sell or hold a security. Do not act or rely upon the information and advice given in this publication without seeking the services of competent and professional legal, tax, or accounting counsel. Publication and distribution of this article is not intended to create, and the information contained herein does not constitute, an attorney-client relationship. No recommendation or advice is being given as to whether any investment or strategy is suitable for a particular investor. It should not be assumed that any investments in securities, companies, sectors or markets identified and described were or will be profitable. All information is current as of the date of herein and is subject to change without notice. Any views or opinions expressed may not reflect those of the firm as a whole.

Any projections, targets, or estimates in this report are forward looking statements and are based on the firm’s research, analysis, and assumptions. Due to rapidly changing market conditions and the complexity of investment decisions, supplemental information and other sources may be required to make informed investment decisions based on your individual investment objectives and suitability specifications. All expressions of opinions are subject to change without notice. Clients should seek financial advice regarding the appropriateness of investing in any security or investment strategy discussed in this presentation.

Certain economic and market information contained herein has been obtained from published sources prepared by other parties. Zacks Investment Management does not assume any responsibility for the accuracy or completeness of such information. Further, no third party has assumed responsibility for independently verifying the information contained herein and accordingly no such persons make any representations with respect to the accuracy, completeness or reasonableness of the information provided herein. Unless otherwise indicated, market analysis and conclusions are based upon opinions or assumptions that Zacks Investment Management considers to be reasonable.

Any investment inherently involves a high degree of risk, beyond any specific risks discussed herein.

It is not possible to invest directly in an index. Investors pursuing a strategy similar to an index may experience higher or lower returns, which will be reduced by fees and expenses.

The ICE U.S. Dollar Index measures the value of the U.S. Dollar against a basket of currencies of the top six trading partners of the United States, as measured in 1973: the Euro zone, Japan, the United Kingdom, Canada, Sweden, and Switzerland. An investor cannot directly invest in an index. The volatility of the benchmark may be materially different from the individual performance obtained by a specific investor. Zacks Investment Management, Inc. is a wholly-owned subsidiary of Zacks Investment Research.

Zacks Investment Management is an independent Registered Investment Advisory firm that acts as an investment manager for individuals and institutions. Zacks Investment Research is a provider of earnings data and other financial data to institutions and to individuals.

This material is being provided for informational purposes only and nothing herein constitutes investment, legal, accounting or tax advice, or a recommendation to buy, sell or hold a security. Do not act or rely upon the information and advice given in this publication without seeking the services of competent and professional legal, tax, or accounting counsel. Publication and distribution of this article is not intended to create, and the information contained herein does not constitute, an attorney-client relationship. No recommendation or advice is being given as to whether any investment or strategy is suitable for a particular investor. It should not be assumed that any investments in securities, companies, sectors or markets identified and described were or will be profitable. All information is current as of the date of herein and is subject to change without notice. Any views or opinions expressed may not reflect those of the firm as a whole.

Any projections, targets, or estimates in this report are forward looking statements and are based on the firm’s research, analysis, and assumptions. Due to rapidly changing market conditions and the complexity of investment decisions, supplemental information and other sources may be required to make informed investment decisions based on your individual investment objectives and suitability specifications. All expressions of opinions are subject to change without notice. Clients should seek financial advice regarding the appropriateness of investing in any security or investment strategy discussed in this presentation.

Certain economic and market information contained herein has been obtained from published sources prepared by other parties. Zacks Investment Management does not assume any responsibility for the accuracy or completeness of such information. Further, no third party has assumed responsibility for independently verifying the information contained herein and accordingly no such persons make any representations with respect to the accuracy, completeness or reasonableness of the information provided herein. Unless otherwise indicated, market analysis and conclusions are based upon opinions or assumptions that Zacks Investment Management considers to be reasonable. Any investment inherently involves a high degree of risk, beyond any specific risks discussed herein.

The S&P 500 Index is a well-known, unmanaged index of the prices of 500 large-company common stocks, mainly blue-chip stocks, selected by Standard & Poor’s. The S&P 500 Index assumes reinvestment of dividends but does not reflect advisory fees. The volatility of the benchmark may be materially different from the individual performance obtained by a specific investor. An investor cannot invest directly in an index. The Russell 1000 Growth Index is a well-known, unmanaged index of the prices of 1000 large-company growth common stocks selected by Russell.

The Russell 1000 Growth Index assumes reinvestment of dividends but does not reflect advisory fees. An investor cannot invest directly in an index. The volatility of the benchmark may be materially different from the individual performance obtained by a specific investor.

Nasdaq Composite Index is the market capitalization-weighted index of over 3,300 common equities listed on the Nasdaq stock exchange. The types of securities in the index include American depositary receipts, common stocks, real estate investment trusts (REITs) and tracking stocks, as well as limited partnership interests. The index includes all Nasdaq-listed stocks that are not derivatives, preferred shares, funds, exchange-traded funds (ETFs) or debenture securities. An investor cannot invest directly in an index. The volatility of the benchmark may be materially different from the individual performance obtained by a specific investor.

The Dow Jones Industrial Average measures the daily stock market movements of 30 U.S. publicly-traded companies listed on the NASDAQ or the New York Stock Exchange (NYSE). The 30 publicly-owned companies are considered leaders in the United States economy. An investor cannot directly invest in an index. The volatility of the benchmark may be materially different from the individual performance obtained by a specific investor.

The Bloomberg Global Aggregate Index is a flagship measure of global investment grade debt from twenty-four local currency markets. This multi-currency benchmark includes treasury, government-related, corporate and securitized fixed-rate bonds from both developed and emerging markets issuers. An investor cannot invest directly in an index. The volatility of the benchmark may be materially different from the individual performance obtained by a specific investor.

The ICE Exchange-Listed Fixed & Adjustable Rate Preferred Securities Index is a modified market capitalization weighted index composed of preferred stock and securities that are functionally equivalent to preferred stock including, but not limited to, depositary preferred securities, perpetual subordinated debt and certain securities issued by banks and other financial institutions that are eligible for capital treatment with respect to such instruments akin to that received for issuance of straight preferred stock. An investor cannot invest directly in an index. The volatility of the benchmark may be materially different from the individual performance obtained by a specific investor.

The CBOE Volatility Index (VIX) is a calculation designed to produce a measure of constant, 30-day expected volatility of the U.S. stock market, derived from real-time, mid-quote prices of S&P 500 Index call and put options. On a global basis, it is one of the most recognized measures of volatility — widely reported by financial media and closely followed by a variety of market participants as a daily market indicator. The volatility of the benchmark may be materially different from the individual performance obtained by a specific investor. An investor cannot invest directly in an index. The NASDAQ-100 Index includes 100 of the largest domestic and international non-financial companies listed on The NASDAQ Stock Market based on market capitalization. The Index reflects companies across major industry groups including computer hardware and software, telecommunications, retail/wholesale trade and biotechnology. Index composition is reviewed on an annual basis in December. An investor cannot invest directly in an index.

Mitch Zacks – Weekly Market Commentary: U.S. Debt Has Crossed Over 100% of GDP. Here’s Our Take on What That Means.

By Weekly Market Commentary

The chart below has made the rounds over the past week, as the U.S. national debt has officially surpassed 100% of gross domestic product (GDP). Outside of a brief spike during the pandemic, the U.S. has not ended a fiscal year above the 100% mark since the aftermath of World War II.1

Investors are understandably concerned. Federal deficits remain historically large, while rising interest rates have increased the cost of servicing that debt. In 2026, the deficit is projected to reach nearly $2 trillion, with roughly one out of every seven taxpayer dollars going toward interest payments.

This is not an issue to be dismissive about, in my view. The long-term fiscal trajectory of the United States is an issue policymakers will eventually need to address, particularly as an aging population places additional pressure on programs like Social Security and Medicare. This comes at a time when political problems have become increasingly difficult to solve.

That all being said, I also think it is important to separate the symbolism of crossing 100% debt-to-GDP from the actual near-term implications for markets and the economy.

One reason is that debt-to-GDP, while widely cited, is an imperfect standalone measure of fiscal stress in the U.S. GDP measures one year of economic output, while federal debt is the cumulative result of borrowing built up over decades. Comparing the two can provide useful context, but it does not necessarily tell us whether a debt burden has become immediately unmanageable.

Market participants rightly focus more closely on the government’s ability to service its debt, particularly the relationship between interest payments and tax receipts. As the chart below shows, interest costs as a share of government revenues have risen meaningfully in recent years. But they also remain below peaks reached during the 1980s and early 1990s, which were periods marked by elevated interest rates and fiscal concerns.

Investors are understandably concerned. Federal deficits remain historically large, while rising interest rates have increased the cost of servicing that debt. In 2026, the deficit is projected to reach nearly $2 trillion, with roughly one out of every seven taxpayer dollars going toward interest payments.

This is not an issue to be dismissive about, in my view. The long-term fiscal trajectory of the United States is an issue policymakers will eventually need to address, particularly as an aging population places additional pressure on programs like Social Security and Medicare. This comes at a time when political problems have become increasingly difficult to solve.

That all being said, I also think it is important to separate the symbolism of crossing 100% debt-to-GDP from the actual near-term implications for markets and the economy.

One reason is that debt-to-GDP, while widely cited, is an imperfect standalone measure of fiscal stress in the U.S. GDP measures one year of economic output, while federal debt is the cumulative result of borrowing built up over decades. Comparing the two can provide useful context, but it does not necessarily tell us whether a debt burden has become immediately unmanageable.

Market participants rightly focus more closely on the government’s ability to service its debt, particularly the relationship between interest payments and tax receipts. As the chart below shows, interest costs as a share of government revenues have risen meaningfully in recent years. But they also remain below peaks reached during the 1980s and early 1990s, which were periods marked by elevated interest rates and fiscal concerns.

If we look at this data another way, by comparing annual federal tax receipts (green line, chart below) to annual interest payments on government debt (blue line, chart below), you can see that the government has plenty of means to stay current on debt payments. This is also why markets are not yet treating U.S. debt as a near-term solvency issue.

U.S. equity markets have risen throughout this rapid debt accumulation period, and importantly, the 10-year Treasury yield remains below its long-term historical average. Demand for U.S. Treasurys remains strong globally, supported by the dollar’s role as the world’s reserve currency and the Treasury market’s position at the center of the global financial system. I do not think we’d see this type of reaction from markets if the 100% debt-to-GDP ratio was a meaningful metric.

Bottom Line for Investors

History offers an important perspective. The last time the debt-to-GDP ratio exceeded current levels was in 1946, when debt reached more than 106% of GDP following World War II. That burden eventually declined not because the government aggressively paid down debt, but because economic growth, inflation, and rising productivity allowed the economy to outgrow it over time.

Crossing the 100% debt-to-GDP threshold is therefore best viewed less as an immediate market signal and more as a reminder of a long-term challenge that will eventually require political and economic adjustment. The more relevant questions for investors are whether the U.S. can continue financing its obligations sustainably, whether economic growth remains resilient, and whether markets maintain confidence in the broader system. At least for now, those conditions largely remain in place.

1 Wall Street Journal. May 12, 2026. https://www.wsj.com/economy/cpi-inflation-report-april62b11096?mod=economy_trendingnow_article_pos1

2 Fred Economic Data. March 12, 2026. https://fred.stlouisfed.org/series/CPIAUCSL

3 CNN. March 9, 2026. https://www.cnn.com/2026/05/07/business/tariff-case-ten-percent-trump-courtinternational-trade

4 The NY Times. May 9, 2026. https://www.nytimes.com/2026/05/09/business/china-april-trade-exportsimports.html?unlocked_article_code=1.h1A.ABt5.kCtSBqVRv4uP&smid=url-share

DISCLOSURE
Past performance is no guarantee of future results. Inherent in any investment is the potential for loss.

Zacks Investment Management, Inc. is a wholly-owned subsidiary of Zacks Investment Research. Zacks Investment Management is an independent Registered Investment Advisory firm and acts as an investment manager for individuals and institutions. Zacks Investment Research is a provider of earnings data and other financial data to institutions and to individuals.

This material is being provided for informational purposes only and nothing herein constitutes investment, legal, accounting or tax advice, or a recommendation to buy, sell or hold a security. Do not act or rely upon the information and advice given in this publication without seeking the services of competent and professional legal, tax, or accounting counsel. Publication and distribution of this article is not intended to create, and the information contained herein does not constitute, an attorney-client relationship. No recommendation or advice is being given as to whether any investment or strategy is suitable for a particular investor. It should not be assumed that any investments in securities, companies, sectors or markets identified and described were or will be profitable. All information is current as of the date of herein and is subject to change without notice. Any views or opinions expressed may not reflect those of the firm as a whole.

Any projections, targets, or estimates in this report are forward looking statements and are based on the firm’s research, analysis, and assumptions. Due to rapidly changing market conditions and the complexity of investment decisions, supplemental information and other sources may be required to make informed investment decisions based on your individual investment objectives and suitability specifications. All expressions of opinions are subject to change without notice. Clients should seek financial advice regarding the appropriateness of investing in any security or investment strategy discussed in this presentation.

Certain economic and market information contained herein has been obtained from published sources prepared by other parties. Zacks Investment Management does not assume any responsibility for the accuracy or completeness of such information. Further, no third party has assumed responsibility for independently verifying the information contained herein and accordingly no such persons make any representations with respect to the accuracy, completeness or reasonableness of the information provided herein. Unless otherwise indicated, market analysis and conclusions are based upon opinions or assumptions that Zacks Investment Management considers to be reasonable.

Any investment inherently involves a high degree of risk, beyond any specific risks discussed herein.

It is not possible to invest directly in an index. Investors pursuing a strategy similar to an index may experience higher or lower returns, which will be reduced by fees and expenses.

The ICE U.S. Dollar Index measures the value of the U.S. Dollar against a basket of currencies of the top six trading partners of the United States, as measured in 1973: the Euro zone, Japan, the United Kingdom, Canada, Sweden, and Switzerland. An investor cannot directly invest in an index. The volatility of the benchmark may be materially different from the individual performance obtained by a specific investor. Zacks Investment Management, Inc. is a wholly-owned subsidiary of Zacks Investment Research.

Zacks Investment Management is an independent Registered Investment Advisory firm that acts as an investment manager for individuals and institutions. Zacks Investment Research is a provider of earnings data and other financial data to institutions and to individuals.

This material is being provided for informational purposes only and nothing herein constitutes investment, legal, accounting or tax advice, or a recommendation to buy, sell or hold a security. Do not act or rely upon the information and advice given in this publication without seeking the services of competent and professional legal, tax, or accounting counsel. Publication and distribution of this article is not intended to create, and the information contained herein does not constitute, an attorney-client relationship. No recommendation or advice is being given as to whether any investment or strategy is suitable for a particular investor. It should not be assumed that any investments in securities, companies, sectors or markets identified and described were or will be profitable. All information is current as of the date of herein and is subject to change without notice. Any views or opinions expressed may not reflect those of the firm as a whole.

Any projections, targets, or estimates in this report are forward looking statements and are based on the firm’s research, analysis, and assumptions. Due to rapidly changing market conditions and the complexity of investment decisions, supplemental information and other sources may be required to make informed investment decisions based on your individual investment objectives and suitability specifications. All expressions of opinions are subject to change without notice. Clients should seek financial advice regarding the appropriateness of investing in any security or investment strategy discussed in this presentation.

Certain economic and market information contained herein has been obtained from published sources prepared by other parties. Zacks Investment Management does not assume any responsibility for the accuracy or completeness of such information. Further, no third party has assumed responsibility for independently verifying the information contained herein and accordingly no such persons make any representations with respect to the accuracy, completeness or reasonableness of the information provided herein. Unless otherwise indicated, market analysis and conclusions are based upon opinions or assumptions that Zacks Investment Management considers to be reasonable. Any investment inherently involves a high degree of risk, beyond any specific risks discussed herein.

The S&P 500 Index is a well-known, unmanaged index of the prices of 500 large-company common stocks, mainly blue-chip stocks, selected by Standard & Poor’s. The S&P 500 Index assumes reinvestment of dividends but does not reflect advisory fees. The volatility of the benchmark may be materially different from the individual performance obtained by a specific investor. An investor cannot invest directly in an index. The Russell 1000 Growth Index is a well-known, unmanaged index of the prices of 1000 large-company growth common stocks selected by Russell.

The Russell 1000 Growth Index assumes reinvestment of dividends but does not reflect advisory fees. An investor cannot invest directly in an index. The volatility of the benchmark may be materially different from the individual performance obtained by a specific investor.

Nasdaq Composite Index is the market capitalization-weighted index of over 3,300 common equities listed on the Nasdaq stock exchange. The types of securities in the index include American depositary receipts, common stocks, real estate investment trusts (REITs) and tracking stocks, as well as limited partnership interests. The index includes all Nasdaq-listed stocks that are not derivatives, preferred shares, funds, exchange-traded funds (ETFs) or debenture securities. An investor cannot invest directly in an index. The volatility of the benchmark may be materially different from the individual performance obtained by a specific investor.

The Dow Jones Industrial Average measures the daily stock market movements of 30 U.S. publicly-traded companies listed on the NASDAQ or the New York Stock Exchange (NYSE). The 30 publicly-owned companies are considered leaders in the United States economy. An investor cannot directly invest in an index. The volatility of the benchmark may be materially different from the individual performance obtained by a specific investor.

The Bloomberg Global Aggregate Index is a flagship measure of global investment grade debt from twenty-four local currency markets. This multi-currency benchmark includes treasury, government-related, corporate and securitized fixed-rate bonds from both developed and emerging markets issuers. An investor cannot invest directly in an index. The volatility of the benchmark may be materially different from the individual performance obtained by a specific investor.

The ICE Exchange-Listed Fixed & Adjustable Rate Preferred Securities Index is a modified market capitalization weighted index composed of preferred stock and securities that are functionally equivalent to preferred stock including, but not limited to, depositary preferred securities, perpetual subordinated debt and certain securities issued by banks and other financial institutions that are eligible for capital treatment with respect to such instruments akin to that received for issuance of straight preferred stock. An investor cannot invest directly in an index. The volatility of the benchmark may be materially different from the individual performance obtained by a specific investor.

The CBOE Volatility Index (VIX) is a calculation designed to produce a measure of constant, 30-day expected volatility of the U.S. stock market, derived from real-time, mid-quote prices of S&P 500 Index call and put options. On a global basis, it is one of the most recognized measures of volatility — widely reported by financial media and closely followed by a variety of market participants as a daily market indicator. The volatility of the benchmark may be materially different from the individual performance obtained by a specific investor. An investor cannot invest directly in an index. The NASDAQ-100 Index includes 100 of the largest domestic and international non-financial companies listed on The NASDAQ Stock Market based on market capitalization.

Mitch Zacks – Weekly Market Commentary: Fed Holds Rates Steady, but the Real Story is What Happens Next

By Weekly Market Commentary

Investors can be forgiven for missing the Federal Reserve’s most recent rate decision, which saw them holding the benchmark fed funds rate at 3.50% to 3.75%. Markets were almost universally expecting a pause, which removed any newsworthiness from the announcement.1

But that doesn’t mean the meeting was irrelevant.

Parsing through some of the Fed governors’ framings and positionings, it was clear that the Fed’s stance had shifted. In prior months, the debate had centered more on whether inflation was gradually moving back toward target. In the April meeting, the Fed appeared to be emphasizing renewed upside risks, particularly from energy. The “wait-and-see” mindset was more prevalent than it had been in recent meetings.

This distinction is notable as the Fed approaches a leadership transition. Kevin Warsh is poised to take over as Fed Chair in June, and he appears likely to bring a different framework to how the Fed operates, particularly around communication, inflation measurement, and the size of the Fed’s balance sheet. The media swirl around Warsh’s nomination may make it seem like these changes could be disruptive, but I don’t think that’s the case at all.

For starters, the Fed is not a one-person institution. A chair can shape the debate, set the tone, and guide the committee. But monetary policy is still made by a group of governors and regional Fed presidents, many of whom appear reluctant to move quickly while inflation remains above target and energy prices are rising.

That committee structure also helps explain why the more extreme concerns about Fed independence did not come to fruition. There had been worries that the Fed’s institutional structure could be disrupted or that leadership changes could alter the balance of power inside the central bank. None of that happened. Recently, the regional Fed presidents’ terms were extended, high-profile personnel changes did not materialize, and the Fed remains a committee-driven institution. For markets, the uncertainty around these somewhat political issues has all but faded, in my view.

The Fed will probably look more like business as usual, but I do foresee a gradual shift in emphasis. One area where Warsh’s views are especially important is the Fed’s balance sheet. Warsh served as a Fed governor under Ben Bernanke during the 2008 Global Financial Crisis, when the Fed dramatically expanded its use of quantitative easing. Warsh is often associated with the view that the Fed should have emergency balancesheet powers, but that the bar for using them should be high.

The Fed’s balance sheet remains very large, at more than $6 trillion, even after several years of runoff from its pandemic-era peak. Warsh has argued in the past that the Fed’s balance sheet should be smaller, and a Warsh-led Fed may place more emphasis on reducing the central bank’s footprint in Treasury and mortgage markets. In my view, however, Warsh is likely to proceed cautiously. Balance-sheet runoff is a form of liquidity tightening. If the Fed drains reserves too quickly or reduces its holdings too abruptly, it can put upward pressure on longer-duration interest rates. That could create issues for mortgages, corporate borrowing costs, and equity valuations—none of which Warsh will want.

To offset the effects of balance sheet tightening, we may see more coordination with the U.S. Treasury and an effort to push regulatory reforms that allow banks to hold fewer reserves. Adjustments to liquidity requirements or related bank regulations could, in theory, make it easier for the Fed to operate with a smaller balance sheet. This will be the thing to watch during Warsh’s term, in my view.

To be sure, I still think Warsh will make the case for lower interest rates. His argument will likely be that the recent oil shock is a supply-side issue, not evidence of demanddriven inflation. He may also point to improving productivity as a disinflationary force, especially if artificial intelligence and other technologies allow businesses to produce more output with fewer cost pressures. In the 1990s, stronger productivity growth helped the economy grow at a healthy pace without generating the kind of inflation that might otherwise have forced the Fed into a more restrictive stance. If productivity is rising again, which it currently is (see chart below), Warsh may argue that the Fed should not focus only on backward-looking inflation data.

Warsh may be more inclined to look through supply-driven inflation, but the committee may not be ready to do the same. And in my view, that’s not necessarily a negative. If growth remains positive, earnings continue to expand, and inflation does not accelerate materially, stocks do not necessarily need Fed cuts to move higher.

Bottom Line for Investors

The Fed’s decision to pause rate cuts was expected, but the bigger story is the policy environment taking shape for the rest of 2026 and beyond. A Warsh-led Fed may bring a different framework to monetary policy, with more attention paid to productivity, supply-driven inflation, and the size of the Fed’s balance sheet. Worries about collapsing Fed independence or a Fed doing the bidding of the executive branch are overblown, in my view. The Fed remains a committee-driven institution, and many voting members will likely want clearer evidence that inflation is moving back toward target before easing policy.

For investors, the key point right now is that markets appear to have already adjusted to the possibility of no rate cuts this year. That lowers the risk that a prolonged pause becomes a major negative surprise. In my view, the next phase of Fed policy may be less about whether the Fed cuts by 25-basis points, and more about how it manages liquidity, inflation expectations, and the long end of the yield curve.

1 CNBC. April 30, 2026. https://www.cnbc.com/2026/04/30/pce-inflation-rate-march-2026.html

2 Fred Economic Data. 2026.

3 Wall Street Journal. May 4, 2026. https://www.wsj.com/articles/the-great-110-trillion-wealthtransfer-wont-happen-any-time-soon-e8b2ef31

4 Wall Street Journal. May 3, 2026. https://www.wsj.com/economy/global/global-economy-iranenergy-abd8828f?mod=economy_lead_pos4

DISCLOSURE
Past performance is no guarantee of future results. Inherent in any investment is the potential for loss.

Zacks Investment Management, Inc. is a wholly-owned subsidiary of Zacks Investment Research. Zacks Investment Management is an independent Registered Investment Advisory firm and acts as an investment manager for individuals and institutions. Zacks Investment Research is a provider of earnings data and other financial data to institutions and to individuals.

This material is being provided for informational purposes only and nothing herein constitutes investment, legal, accounting or tax advice, or a recommendation to buy, sell or hold a security. Do not act or rely upon the information and advice given in this publication without seeking the services of competent and professional legal, tax, or accounting counsel. Publication and distribution of this article is not intended to create, and the information contained herein does not constitute, an attorney-client relationship. No recommendation or advice is being given as to whether any investment or strategy is suitable for a particular investor. It should not be assumed that any investments in securities, companies, sectors or markets identified and described were or will be profitable. All information is current as of the date of herein and is subject to change without notice. Any views or opinions expressed may not reflect those of the firm as a whole.

Any projections, targets, or estimates in this report are forward looking statements and are based on the firm’s research, analysis, and assumptions. Due to rapidly changing market conditions and the complexity of investment decisions, supplemental information and other sources may be required to make informed investment decisions based on your individual investment objectives and suitability specifications. All expressions of opinions are subject to change without notice. Clients should seek financial advice regarding the appropriateness of investing in any security or investment strategy discussed in this presentation.

Certain economic and market information contained herein has been obtained from published sources prepared by other parties. Zacks Investment Management does not assume any responsibility for the accuracy or completeness of such information. Further, no third party has assumed responsibility for independently verifying the information contained herein and accordingly no such persons make any representations with respect to the accuracy, completeness or reasonableness of the information provided herein. Unless otherwise indicated, market analysis and conclusions are based upon opinions or assumptions that Zacks Investment Management considers to be reasonable.

Any investment inherently involves a high degree of risk, beyond any specific risks discussed herein.

It is not possible to invest directly in an index. Investors pursuing a strategy similar to an index may experience higher or lower returns, which will be reduced by fees and expenses.

The ICE U.S. Dollar Index measures the value of the U.S. Dollar against a basket of currencies of the top six trading partners of the United States, as measured in 1973: the Euro zone, Japan, the United Kingdom, Canada, Sweden, and Switzerland. An investor cannot directly invest in an index. The volatility of the benchmark may be materially different from the individual performance obtained by a specific investor.

Zacks Investment Management, Inc. is a wholly-owned subsidiary of Zacks Investment Research. Zacks Investment Management is an independent Registered Investment Advisory firm that acts as an investment manager for individuals and institutions. Zacks Investment Research is a provider of earnings data and other financial data to institutions and to individuals.

This material is being provided for informational purposes only and nothing herein constitutes investment, legal, accounting or tax advice, or a recommendation to buy, sell or hold a security. Do not act or rely upon the information and advice given in this publication without seeking the services of competent and professional legal, tax, or accounting counsel. Publication and distribution of this article is not intended to create, and the information contained herein does not constitute, an attorney-client relationship. No recommendation or advice is being given as to whether any investment or strategy is suitable for a particular investor. It should not be assumed that any investments in securities, companies, sectors or markets identified and described were or will be profitable. All information is current as of the date of herein and is subject to change without notice. Any views or opinions expressed may not reflect those of the firm as a whole.

Any projections, targets, or estimates in this report are forward looking statements and are based on the firm’s research, analysis, and assumptions. Due to rapidly changing market conditions and the complexity of investment decisions, supplemental information and other sources may be required to make informed investment decisions based on your individual investment objectives and suitability specifications. All expressions of opinions are subject to change without notice. Clients should seek financial advice regarding the appropriateness of investing in any security or investment strategy discussed in this presentation.

Certain economic and market information contained herein has been obtained from published sources prepared by other parties. Zacks Investment Management does not assume any responsibility for the accuracy or completeness of such information. Further, no third party has assumed responsibility for independently verifying the information contained herein and accordingly no such persons make any representations with respect to the accuracy, completeness or reasonableness of the information provided herein. Unless otherwise indicated, market analysis and conclusions are based upon opinions or assumptions that Zacks Investment Management considers to be reasonable. Any investment inherently involves a high degree of risk, beyond any specific risks discussed herein.

The S&P 500 Index is a well-known, unmanaged index of the prices of 500 large-company common stocks, mainly blue-chip stocks, selected by Standard & Poor’s. The S&P 500 Index assumes reinvestment of dividends but does not reflect advisory fees. The volatility of the benchmark may be materially different from the individual performance obtained by a specific investor. An investor cannot invest directly in an index. The Russell 1000 Growth Index is a well-known, unmanaged index of the prices of 1000 large-company growth common stocks selected by Russell.

The Russell 1000 Growth Index assumes reinvestment of dividends but does not reflect advisory fees. An investor cannot invest directly in an index. The volatility of the benchmark may be materially different from the individual performance obtained by a specific investor.

Nasdaq Composite Index is the market capitalization-weighted index of over 3,300 common equities listed on the Nasdaq stock exchange. The types of securities in the index include American depositary receipts, common stocks, real estate investment trusts (REITs) and tracking stocks, as well as limited partnership interests. The index includes all Nasdaq-listed stocks that are not derivatives, preferred shares, funds, exchange-traded funds (ETFs) or debenture securities. An investor cannot invest directly in an index. The volatility of the benchmark may be materially different from the individual performance obtained by a specific investor.

The Dow Jones Industrial Average measures the daily stock market movements of 30 U.S. publicly-traded companies listed on the NASDAQ or the New York Stock Exchange (NYSE). The 30 publicly-owned companies are considered leaders in the United States economy. An investor cannot directly invest in an index. The volatility of the benchmark may be materially different from the individual performance obtained by a specific investor.

The Bloomberg Global Aggregate Index is a flagship measure of global investment grade debt from twenty-four local currency markets. This multi-currency benchmark includes treasury, government-related, corporate and securitized fixed-rate bonds from both developed and emerging markets issuers. An investor cannot invest directly in an index. The volatility of the benchmark may be materially different from the individual performance obtained by a specific investor.

The ICE Exchange-Listed Fixed & Adjustable Rate Preferred Securities Index is a modified market capitalization weighted index composed of preferred stock and securities that are functionally equivalent to preferred stock including, but not limited to, depositary preferred securities, perpetual subordinated debt and certain securities issued by banks and other financial institutions that are eligible for capital treatment with respect to such instruments akin to that received for issuance of straight preferred stock. An investor cannot invest directly in an index. The volatility of the benchmark may be materially different from the individual performance obtained by a specific investor.

The CBOE Volatility Index (VIX) is a calculation designed to produce a measure of constant, 30-day expected volatility of the U.S. stock market, derived from real-time, mid-quote prices of S&P 500 Index call and put options. On a global basis, it is one of the most recognized measures of volatility — widely reported by financial media and closely followed by a variety of market participants as a daily market indicator. The volatility of the benchmark may be materially different from the individual performance obtained by a specific investor. An investor cannot invest directly in an index. The NASDAQ-100 Index includes 100 of the largest domestic and international non-financial companies listed on The NASDAQ Stock Market based on market capitalization. The Index reflects companies across major industry groups including computer hardware and software, telecommunications, retail/wholesale trade and biotechnology. Index composition is reviewed on an annual basis in December. An investor cannot invest directly in an index.