
Market volatility continues apace, as news headlines, and even simple statements or policy hints, have shown the ability to move markets quickly in both directions. This kind of short-term volatility can feel like it carries greater meaning in the moment. But it doesn’t always tell us much about what is happening beneath the surface. In fact, it often gives investors the wrong message.1
My case-in-point this week: the growing gap between the market’s largest growth stocks and the broader index. As shown below, the once-heralded names in Technology and the “Magnificent Seven” have declined significantly more than the S&P 500 overall in 2026, with drawdowns approaching three times the magnitude of the broader market.
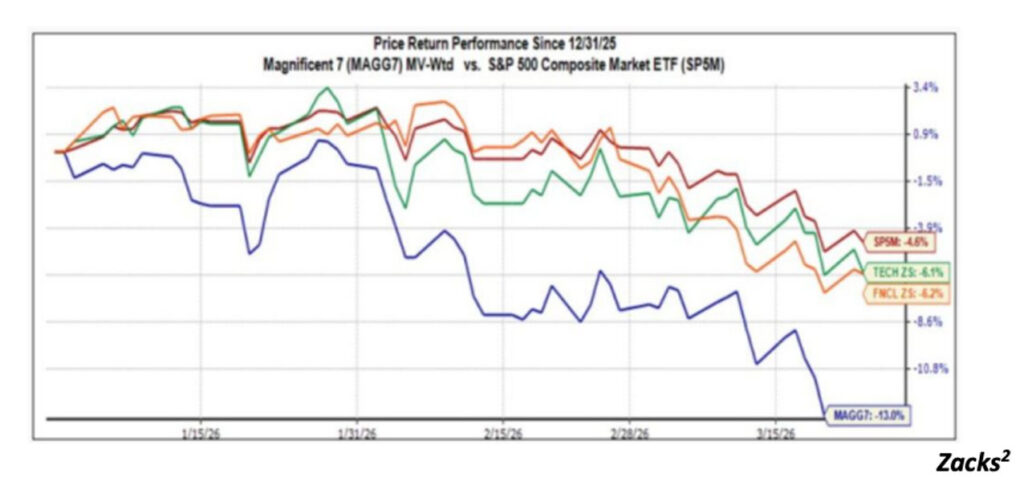
This divergence is notable not just because of the size of the move, but because of what is happening on the fundamental side at the same time.
‘Mag 7’ and Tech represent the largest growth-oriented segment of the market, and they continue to deliver the strongest earnings growth in the index. The Technology sector, broadly defined, is expected to produce earnings growth of more than 25% in the first quarter on over 20% revenue growth. By comparison, total S&P 500 earnings are expected to rise in the low double digits, and closer to mid-single digits if you exclude Technology’s contribution.
In other words, the sector doing the most to drive earnings growth is also the one experiencing the most pronounced selling pressure.
In fairness, some of this may reflect valuation concerns. Large-cap growth stocks entered the year trading at elevated multiples, and in periods of uncertainty, investors often trim exposure to the most expensive areas of the market first. There are also legitimate questions about how artificial intelligence may reshape competitive dynamics over time, particularly across software and digital platforms. But even taking those factors into account, the magnitude of the recent move appears disproportionate to what we are seeing in current earnings data. If anything, the disconnect suggests that expectations are being reset more quickly than fundamentals are deteriorating. In my experience, that’s a classic sign of a correction, not the beginning of a bear market.
The earnings revisions trend reinforces my argument. Since the start of the year, estimates for the Technology sector have continued to move higher, even as stock prices have come under pressure. The positive earnings revision trend has not been isolated to one corner of the market either, as roughly half of all sectors have seen upward estimate revisions since March, including Financials, Materials, and Industrials. This is not what we typically see in an environment where markets are pricing in a broad earnings slowdown.
Periods like this also tend to reward a disciplined, earnings-driven approach. Corrections driven by sentiment and positioning tend to feel uncomfortable in real time, particularly when leadership is involved, but they often unfold without the kind of broad-based deterioration that typically defines more severe downturns. Strategies that emphasize earnings growth, estimate revisions, and diversification get rewarded most when markets recover.
Bottom Line for Investors
The recent underperformance of large growth stocks is a notable development, but it is important to understand what I believe is driving it. While valuations and longer-term growth expectations are being reassessed, the underlying earnings picture remains relatively strong, with positive revisions across multiple sectors. That combination points more toward a shift in sentiment and positioning than a breakdown in fundamentals.
For investors, it is a reminder that short-term market moves do not always align neatly with earnings trends, and that maintaining diversification across sectors and styles remains critical when leadership changes. It is also worth remembering that when corrections run their course, the areas that were hit hardest often rebound the fastest. For strategies like Zacks Focus Growth, which can create an opportunity to participate when sentiment resets and fundamentals reassert themselves.
1 Zacks.com. March 25, 2026. https://advisor.zacksim.com/e/376582/ook-improving-despite-iran-war/5v9rbd/1502440565/h/pbQqWP-2Yk8SHW9j_XAlA4v4kFANs5-7t3qSo9oDVVk
2 Zacks.com. March 25, 2026. https://advisor.zacksim.com/e/376582/ook-improving-despite-iran-war/5v9rbd/1502440565/h/pbQqWP-2Yk8SHW9j_XAlA4v4kFANs5-7t3qSo9oDVVk
DISCLOSURE
Past performance is no guarantee of future results. Inherent in any investment is the potential for loss.
Zacks Investment Management, Inc. is a wholly-owned subsidiary of Zacks Investment Research. Zacks Investment Management is an independent Registered Investment Advisory firm and acts as an investment manager for individuals and institutions. Zacks Investment Research is a provider of earnings data and other financial data to institutions and to individuals.
This material is being provided for informational purposes only and nothing herein constitutes investment, legal, accounting or tax advice, or a recommendation to buy, sell or hold a security. Do not act or rely upon the information and advice given in this publication without seeking the services of competent and professional legal, tax, or accounting counsel. Publication and distribution of this article is not intended to create, and the information contained herein does not constitute, an attorney-client relationship. No recommendation or advice is being given as to whether any investment or strategy is suitable for a particular investor. It should not be assumed that any investments in securities, companies, sectors or markets identified and described were or will be profitable. All information is current as of the date of herein and is subject to change without notice. Any views or opinions expressed may not reflect those of the firm as a whole.
Any projections, targets, or estimates in this report are forward looking statements and are based on the firm’s research, analysis, and assumptions. Due to rapidly changing market conditions and the complexity of investment decisions, supplemental information and other sources may be required to make informed investment decisions based on your individual investment objectives and suitability specifications. All expressions of opinions are subject to change without notice. Clients should seek financial advice regarding the appropriateness of investing in any security or investment strategy discussed in this presentation.
Certain economic and market information contained herein has been obtained from published sources prepared by other parties. Zacks Investment Management does not assume any responsibility for the accuracy or completeness of such information. Further, no third party has assumed responsibility for independently verifying the information contained herein and accordingly no such persons make any representations with respect to the accuracy, completeness or reasonableness of the information provided herein. Unless otherwise indicated, market analysis and conclusions are based upon opinions or assumptions that Zacks Investment Management considers to be reasonable. Any investment inherently involves a high degree of risk, beyond any specific risks discussed herein.
The S&P 500 Index is a well-known, unmanaged index of the prices of 500 large-company common stocks, mainly blue-chip stocks, selected by Standard & Poor’s. The S&P 500 Index assumes reinvestment of dividends but does not reflect advisory fees. The volatility of the benchmark may be materially different from the individual performance obtained by a specific investor. An investor cannot invest directly in an index.
The Russell 1000 Growth Index is a well-known, unmanaged index of the prices of 1000 large-company growth common stocks selected by Russell. The Russell 1000 Growth Index assumes reinvestment of dividends but does not reflect advisory fees. An investor cannot invest directly in an index. The volatility of the benchmark may be materially different from the individual performance obtained by a specific investor.
Nasdaq Composite Index is the market capitalization-weighted index of over 3,300 common equities listed on the Nasdaq stock exchange. The types of securities in the index include American depositary receipts, common stocks, real estate investment trusts (REITs) and tracking stocks, as well as limited partnership interests. The index includes all Nasdaq-listed stocks that are not derivatives, preferred shares, funds, exchange-traded funds (ETFs) or debenture securities. An investor cannot invest directly in an index. The volatility of the benchmark may be materially different from the individual performance obtained by a specific investor.
The Dow Jones Industrial Average measures the daily stock market movements of 30 U.S. publicly-traded companies listed on the NASDAQ or the New York Stock Exchange (NYSE). The 30 publicly-owned companies are considered leaders in the United States economy. An investor cannot directly invest in an index. The volatility of the benchmark may be materially different from the individual performance obtained by a specific investor.
The Bloomberg Global Aggregate Index is a flagship measure of global investment grade debt from twenty-four local currency markets. This multi-currency benchmark includes treasury, government-related, corporate and securitized fixed-rate bonds from both developed and emerging markets issuers. An investor cannot invest directly in an index. The volatility of the benchmark may be materially different from the individual performance obtained by a specific investor.
The ICE Exchange-Listed Fixed & Adjustable Rate Preferred Securities Index is a modified market capitalization weighted index composed of preferred stock and securities that are functionally equivalent to preferred stock including, but not limited to, depositary preferred securities, perpetual subordinated debt and certain securities issued by banks and other financial institutions that are eligible for capital treatment with respect to such instruments akin to that received for issuance of straight preferred stock. An investor cannot invest directly in an index. The volatility of the benchmark may be materially different from the individual performance obtained by a specific investor.
The MSCI ACWI ex U.S. Index captures large and mid-cap representation across 22 of 23 Developed Markets (DM) countries (excluding the United States) and 24 Emerging Markets (EM) countries. The index covers approximately 85% of the global equity opportunity set outside the U.S. An investor cannot invest directly in an index. The volatility of the benchmark may be materially different from the individual performance obtained by a specific investor.
The Russell 2000 Index is a well-known, unmanaged index of the prices of 2000 small-cap company common stocks, selected by Russell. The Russell 2000 Index assumes reinvestment of dividends but does not reflect advisory fees. An investor cannot invest directly in an index. The volatility of the benchmark may be materially different from the individual performance obtained by a specific investor.
The S&P Mid Cap 400 provides investors with a benchmark for mid-sized companies. The index, which is distinct from the large-cap S&P 500, is designed to measure the performance of 400 mid-sized companies, reflecting the distinctive risk and return characteristics of this market segment.
The S&P 500 Pure Value index is a style-concentrated index designed to track the performance of stocks that exhibit the strongest value characteristics by using a style-attractiveness-weighting scheme. An investor cannot directly invest in an index. The volatility of the benchmark may be materially different from the individual performance obtained by a specific investor.