
Stocks have been on a roll over the past few years, with high double-digit returns from 2023 through the end of last year. But strong performance also has many investors concerned, especially those with extra cash on the sidelines. With elevated valuations and noisy headlines, I often hear investors say: “At these levels, I’d rather wait for a pullback before investing.”
In stock market parlance, this approach is commonly referred to as “buying the dip.” But recent quantitative research shows that such a strategy is flawed, and it can actually hurt investor returns over time.
To be fair, I understand the appeal of a ‘buying the dip’ approach. By waiting for markets to pull back, investors hope to capitalize by buying at a better entry point. It makes sense. But the issue is that historically, markets do not offer these types of opportunities as often as investors might think they do. Indeed, equities spend far more time near highs than in deep or prolonged drawdowns, and when pullbacks do occur, they tend to be short, sharp, and unpredictable. They also tend to follow strong rallies, which “buy-the-dip” investors often end up sitting out.
New quantitative research puts this all in perspective.
A recent study1 tested nearly 200 different “buy the dip” rule sets across long market histories. The findings: more than 60% of the strategies produced worse risk-adjusted outcomes (expressed as a Sharpe ratio) than buy-and-hold strategies. The shortfall wasn’t trivial: across the full sample, the average Sharpe ratio for dip-buying strategies was about 0.04 lower than buy-and-hold.
Notably, the results were even less forgiving in the modern era. Using a post-1989 sample through late 2025, the same research found the average dip-buying strategy delivered a Sharpe ratio about 0.27 lower than staying invested, roughly cutting the dip-buying strategy’s risk-adjusted effectiveness nearly in half. Put another way, over the past 35 years, systematically “buying the dip” created more risk for less return. Most investors don’t want that.
Why did the dip-buying strategies often underperform? Because of the structural cost of waiting.
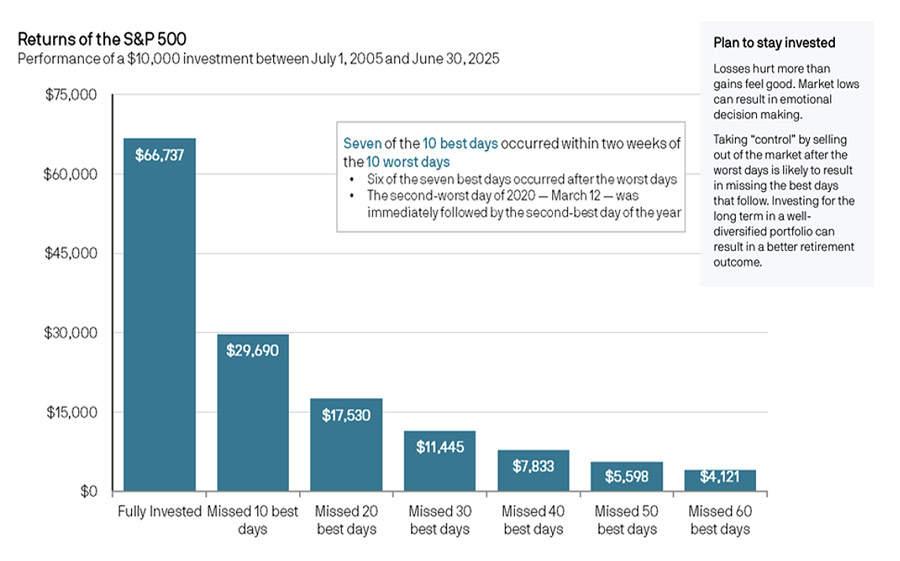
Dip-buying strategies require investors to sit in cash while markets move. During strong periods, equities compound returns through earnings growth and reinvestment, while cash earns little by comparison. Missing even a handful of strong days can have a meaningful impact on long-term outcomes, particularly when earnings growth remains robust, as it did in 2025. As seen in the chart below, missing even just the 10 best days in the market over a long stretch can seriously impact returns to the downside.
For investors who might be waiting to “buy the dip” today, it’s important to reckon with the fact that earnings growth remains strong, while fiscal and monetary policy are factoring as tailwinds. Stocks are due for a pullback, sure. But how much longer could stocks potentially rally before that meaningful correction arrives? That brings up the question of opportunity cost, which “buy the dip” investors must consider.
Remember, waiting for a pullback is not a neutral decision. It is a timing call, and it’s one that history suggests is very difficult to execute successfully. What tends to work better than waiting for the perfect entry is participation with discipline. Dollar-cost averaging can reduce timing risk, while diversification and rebalancing allow investors to manage valuation concerns without stepping entirely to the sidelines. These approaches acknowledge the uncertainty without requiring precision or perfection.
Bottom Line for Investors
I do not want to dismiss investor concerns about valuation. The S&P 500 index trades near 22 times forward earnings, which is close to recent cycle highs. But valuation alone rarely determines short- or intermediate-term returns. In 2025, earnings growth was the primary driver of stock market returns, with roughly two-thirds of the S&P 500’s total return coming from earnings growth. The remainder was split between dividends and only modest changes in valuation multiples. Another strong year for corporate earnings could deliver a similar result.
At the end of the day, in environments where fundamentals remain supportive, the cost of waiting often outweighs the benefit of buying slightly lower—which again, is very difficult to execute.
DISCLOSURE
Past performance is no guarantee of future results. Inherent in any investment is the potential for loss.
Zacks Investment Management, Inc. is a wholly-owned subsidiary of Zacks Investment Research. Zacks Investment Management is an independent Registered Investment Advisory firm and acts as an investment manager for individuals and institutions. Zacks Investment Research is a provider of earnings data and other financial data to institutions and to individuals.
This material is being provided for informational purposes only and nothing herein constitutes investment, legal, accounting or tax advice, or a recommendation to buy, sell or hold a security. Do not act or rely upon the information and advice given in this publication without seeking the services of competent and professional legal, tax, or accounting counsel. Publication and distribution of this article is not intended to create, and the information contained herein does not constitute, an attorney-client relationship. No recommendation or advice is being given as to whether any investment or strategy is suitable for a particular investor. It should not be assumed that any investments in securities, companies, sectors or markets identified and described were or will be profitable. All information is current as of the date of herein and is subject to change without notice. Any views or opinions expressed may not reflect those of the firm as a whole.
Any projections, targets, or estimates in this report are forward looking statements and are based on the firm’s research, analysis, and assumptions. Due to rapidly changing market conditions and the complexity of investment decisions, supplemental information and other sources may be required to make informed investment decisions based on your individual investment objectives and suitability specifications. All expressions of opinions are subject to change without notice. Clients should seek financial advice regarding the appropriateness of investing in any security or investment strategy discussed in this presentation.
Certain economic and market information contained herein has been obtained from published sources prepared by other parties. Zacks Investment Management does not assume any responsibility for the accuracy or completeness of such information. Further, no third party has assumed responsibility for independently verifying the information contained herein and accordingly no such persons make any representations with respect to the accuracy, completeness or reasonableness of the information provided herein. Unless otherwise indicated, market analysis and conclusions are based upon opinions or assumptions that Zacks Investment Management considers to be reasonable. Any investment inherently involves a high degree of risk, beyond any specific risks discussed herein.
The S&P 500 Index is a well-known, unmanaged index of the prices of 500 large-company common stocks, mainly blue-chip stocks, selected by Standard & Poor’s. The S&P 500 Index assumes reinvestment of dividends but does not reflect advisory fees. The volatility of the benchmark may be materially different from the individual performance obtained by a specific investor. An investor cannot invest directly in an index.
The Russell 1000 Growth Index is a well-known, unmanaged index of the prices of 1000 large-company growth common stocks selected by Russell. The Russell 1000 Growth Index assumes reinvestment of dividends but does not reflect advisory fees. An investor cannot invest directly in an index. The volatility of the benchmark may be materially different from the individual performance obtained by a specific investor.
Nasdaq Composite Index is the market capitalization-weighted index of over 3,300 common equities listed on the Nasdaq stock exchange. The types of securities in the index include American depositary receipts, common stocks, real estate investment trusts (REITs) and tracking stocks, as well as limited partnership interests. The index includes all Nasdaq-listed stocks that are not derivatives, preferred shares, funds, exchange-traded funds (ETFs) or debenture securities. An investor cannot invest directly in an index. The volatility of the benchmark may be materially different from the individual performance obtained by a specific investor.
The Dow Jones Industrial Average measures the daily stock market movements of 30 U.S. publicly-traded companies listed on the NASDAQ or the New York Stock Exchange (NYSE). The 30 publicly-owned companies are considered leaders in the United States economy. An investor cannot directly invest in an index. The volatility of the benchmark may be materially different from the individual performance obtained by a specific investor.
The Bloomberg Global Aggregate Index is a flagship measure of global investment grade debt from twenty-four local currency markets. This multi-currency benchmark includes treasury, government-related, corporate and securitized fixed-rate bonds from both developed and emerging markets issuers. An investor cannot invest directly in an index. The volatility of the benchmark may be materially different from the individual performance obtained by a specific investor.
The ICE Exchange-Listed Fixed & Adjustable Rate Preferred Securities Index is a modified market capitalization weighted index composed of preferred stock and securities that are functionally equivalent to preferred stock including, but not limited to, depositary preferred securities, perpetual subordinated debt and certain securities issued by banks and other financial institutions that are eligible for capital treatment with respect to such instruments akin to that received for issuance of straight preferred stock. An investor cannot invest directly in an index. The volatility of the benchmark may be materially different from the individual performance obtained by a specific investor.
The MSCI ACWI ex U.S. Index captures large and mid-cap representation across 22 of 23 Developed Markets (DM) countries (excluding the United States) and 24 Emerging Markets (EM) countries. The index covers approximately 85% of the global equity opportunity set outside the U.S. An investor cannot invest directly in an index. The volatility of the benchmark may be materially different from the individual performance obtained by a specific investor.
The Russell 2000 Index is a well-known, unmanaged index of the prices of 2000 small-cap company common stocks, selected by Russell. The Russell 2000 Index assumes reinvestment of dividends but does not reflect advisory fees. An investor cannot invest directly in an index. The volatility of the benchmark may be materially different from the individual performance obtained by a specific investor.
The S&P Mid Cap 400 provides investors with a benchmark for mid-sized companies. The index, which is distinct from the large-cap S&P 500, is designed to measure the performance of 400 mid-sized companies, reflecting the distinctive risk and return characteristics of this market segment.
The S&P 500 Pure Value index is a style-concentrated index designed to track the performance of stocks that exhibit the strongest value characteristics by using a style-attractiveness-weighting scheme. An investor cannot directly invest in an index. The volatility of the benchmark may be materially different from the individual performance obtained by a specific investor.