The first quarter of 2026 brought many interesting developments for bond investors. Renewed inflation concerns pushed yields higher, reversing early gains and leaving the Bloomberg U.S. Aggregate Bond Index slightly negative for the quarter. At the same time, expectations for Federal Reserve rate cuts shifted meaningfully, with the probability of a cut falling to roughly 37%, down from 72% at the end of 2025.
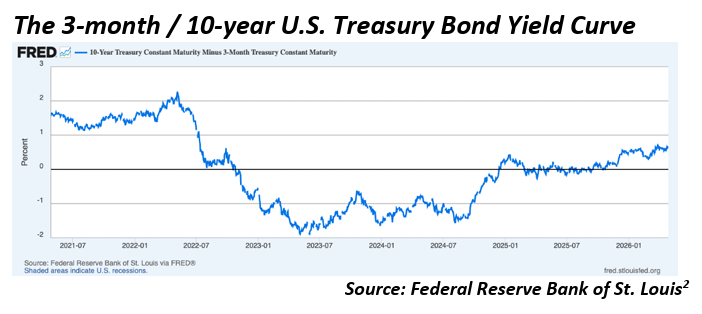
Taken together, these developments drove a notable move in Treasury yields. The 10-year yield rose as high as 4.44% before ending March at 4.32%, while the 2-year climbed to 4.00% before settling near 3.80%.1 Short-term yields rose faster than long-term yields, flattening the curve modestly, though it remains slightly upward sloping (in the chart below, data points above 0 represent an upward sloping yield curve).
While rising yields pressured bond prices, they also improved something largely missing from fixed income for much of the past decade: income. Today’s yields are meaningfully higher than in the post-2010 period, and a larger share of expected returns is now coming from income rather than price appreciation. That shift suggests bonds may once again serve a more traditional role in portfolios, not only as an instrument for reducing overall volatility but also as a source of steady cash flow. In my view, this means investors who have been content with cash (money market) returns in past years may want to give the bond market a closer look. In 2025, broad fixed income returned roughly 7.3%, compared to about 4.3% for cash, marking the first time in several years that bonds meaningfully outperformed. 3 This outperformance reflects both higher starting yields and a gradual steepening in the yield curve, where extending beyond cash is once again being rewarded.
The macro backdrop also appears to be evolving in a way that could support the income story. While headline inflation has moved higher, much of the pressure has been driven by energy prices. Beneath the surface, core inflation remains more contained (2.6% in March), and longer-term expectations have stayed relatively anchored. Meanwhile, we know the labor market is the weak link in the Fed’s inflation/labor mandate. The unemployment rate has risen to approximately 4.3% as of March 2026, up from a 3.4% low in 2023, with hiring trends becoming increasingly uneven. March payrolls rose by +178,000, but in February was revised to -133,000, underscoring volatility in the data.4 If we look more broadly at annual monthly job gains, we can see a stark and steady weakening pattern, which I have argued before likely means a bias towards more cuts in 2026.
For bond investors, this combination is important. Stable underlying inflation helps preserve the real value of income, while signs of a cooling labor market, I think, rule out the possibility of further policy tightening. In practical terms, that means less upward pressure on yields and a more supportive backdrop for bond prices.
Finally, a quick note on the municipal bond market outlook from here. Rising Treasury yields have pushed municipal yields higher as well, improving their relative attractiveness, particularly for investors in higher tax brackets. The yield curve remains slightly upward sloping, and while valuations have not changed dramatically, income levels are more compelling than they were just a few years ago. At the same time, fiscal conditions for state and local governments remain stable, supporting the overall credit backdrop. As a result, municipals continue to serve as a useful tool for tax-efficient income within a diversified fixed income allocation.
Bottom Line for Investors
After years when cash looked unusually competitive and bonds offered limited yield, investors now have more ways to be compensated for taking measured fixed income risk. For investors with cash that is not needed in the near term, but that you still want to treat conservatively, this may be an opportunity to reassess whether staying on the sidelines still offers the best risk/reward tradeoff. Because today’s fixed market offers income that can contribute meaningfully to total return while still playing a stabilizing role in portfolios.
1Wall Street Journal. 2026. https://www.wsj.com/world/middle-east/u-a-e-opec-new-middle-east32ceda56?mod=Searchresults&pos=1&page=1
2 Wall Street Journal. April 30, 2026. https://www.wsj.com/economy/central-banking/u-s-economygrew-at-2-rate-in-first-quarter-6e0c18cc?mod=economy_lead_story
3 Financial Post. April 29, 2026. https://financialpost.com/pmn/business-pmn/us-core-capital-goodsorders-jump-by-most-since-2020
DISCLOSURE
Past performance is no guarantee of future results. Inherent in any investment is the potential for loss.
Zacks Investment Management, Inc. is a wholly-owned subsidiary of Zacks Investment Research. Zacks Investment Management is an independent Registered Investment Advisory firm and acts as an investment manager for individuals and institutions. Zacks Investment Research is a provider of earnings data and other financial data to institutions and to individuals.
This material is being provided for informational purposes only and nothing herein constitutes investment, legal, accounting or tax advice, or a recommendation to buy, sell or hold a security. Do not act or rely upon the information and advice given in this publication without seeking the services of competent and professional legal, tax, or accounting counsel. Publication and distribution of this article is not intended to create, and the information contained herein does not constitute, an attorney-client relationship. No recommendation or advice is being given as to whether any investment or strategy is suitable for a particular investor. It should not be assumed that any investments in securities, companies, sectors or markets identified and described were or will be profitable. All information is current as of the date of herein and is subject to change without notice.
Any views or opinions expressed may not reflect those of the firm as a whole. Any projections, targets, or estimates in this report are forward looking statements and are based on the firm’s research, analysis, and assumptions. Due to rapidly changing market conditions and the complexity of investment decisions, supplemental information and other sources may be required to make informed investment decisions based on your individual investment objectives and suitability specifications. All expressions of opinions are subject to change without notice. Clients should seek financial advice regarding the appropriateness of investing in any security or investment strategy discussed in this presentation.
Certain economic and market information contained herein has been obtained from published sources prepared by other parties. Zacks Investment Management does not assume any responsibility for the accuracy or completeness of such information. Further, no third party has assumed responsibility for independently verifying the information contained herein and accordingly no such persons make any representations with respect to the accuracy, completeness or reasonableness of the information provided herein. Unless otherwise indicated, market analysis and conclusions are based upon opinions or assumptions that Zacks Investment Management considers to be reasonable.
Any investment inherently involves a high degree of risk, beyond any specific risks discussed herein.
It is not possible to invest directly in an index. Investors pursuing a strategy similar to an index may experience higher or lower returns, which will be reduced by fees and expenses.
The ICE U.S. Dollar Index measures the value of the U.S. Dollar against a basket of currencies of the top six trading partners of the United States, as measured in 1973: the Euro zone, Japan, the United Kingdom, Canada, Sweden, and Switzerland. An investor cannot directly invest in an index. The volatility of the benchmark may be materially different from the individual performance obtained by a specific investor. Zacks Investment Management, Inc. is a wholly-owned subsidiary of Zacks Investment Research.
Zacks Investment Management is an independent Registered Investment Advisory firm that acts as an investment manager for individuals and institutions. Zacks Investment Research is a provider of earnings data and other financial data to institutions and to individuals.
This material is being provided for informational purposes only and nothing herein constitutes investment, legal, accounting or tax advice, or a recommendation to buy, sell or hold a security. Do not act or rely upon the information and advice given in this publication without seeking the services of competent and professional legal, tax, or accounting counsel. Publication and distribution of this article is not intended to create, and the information contained herein does not constitute, an attorney-client relationship. No recommendation or advice is being given as to whether any investment or strategy is suitable for a particular investor. It should not be www.zacksim.com | 6 Mitch on the Markets Weekly Client Commentary | April 30, 2026 assumed that any investments in securities, companies, sectors or markets identified and described were or will be profitable. All information is current as of the date of herein and is subject to change without notice. Any views or opinions expressed may not reflect those of the firm as a whole.
Any projections, targets, or estimates in this report are forward looking statements and are based on the firm’s research, analysis, and assumptions. Due to rapidly changing market conditions and the complexity of investment decisions, supplemental information and other sources may be required to make informed investment decisions based on your individual investment objectives and suitability specifications. All expressions of opinions are subject to change without notice. Clients should seek financial advice regarding the appropriateness of investing in any security or investment strategy discussed in this presentation.
Certain economic and market information contained herein has been obtained from published sources prepared by other parties. Zacks Investment Management does not assume any responsibility for the accuracy or completeness of such information. Further, no third party has assumed responsibility for independently verifying the information contained herein and accordingly no such persons make any representations with respect to the accuracy, completeness or reasonableness of the information provided herein. Unless otherwise indicated, market analysis and conclusions are based upon opinions or assumptions that Zacks Investment Management considers to be reasonable. Any investment inherently involves a high degree of risk, beyond any specific risks discussed herein.
The S&P 500 Index is a well-known, unmanaged index of the prices of 500 large-company common stocks, mainly blue-chip stocks, selected by Standard & Poor’s. The S&P 500 Index assumes reinvestment of dividends but does not reflect advisory fees. The volatility of the benchmark may be materially different from the individual performance obtained by a specific investor. An investor cannot invest directly in an index. The Russell 1000 Growth Index is a well-known, unmanaged index of the prices of 1000 large-company growth common stocks selected by Russell.
The Russell 1000 Growth Index assumes reinvestment of dividends but does not reflect advisory fees. An investor cannot invest directly in an index. The volatility of the benchmark may be materially different from the individual performance obtained by a specific investor.
Nasdaq Composite Index is the market capitalization-weighted index of over 3,300 common equities listed on the Nasdaq stock exchange. The types of securities in the index include American depositary receipts, common stocks, real estate investment trusts (REITs) and tracking stocks, as well as limited partnership interests. The index includes all Nasdaq-listed stocks that are not derivatives, preferred shares, funds, exchange-traded funds (ETFs) or debenture securities. An investor cannot invest directly in an index. The volatility of the benchmark may be materially different from the individual performance obtained by a specific investor.
The Dow Jones Industrial Average measures the daily stock market movements of 30 U.S. publicly-traded companies listed on the NASDAQ or the New York Stock Exchange (NYSE). The 30 publicly-owned companies are considered leaders in the United States economy. An investor cannot directly invest in an index. The volatility of the benchmark may be materially different from the individual performance obtained by a specific investor.
The Bloomberg Global Aggregate Index is a flagship measure of global investment grade debt from twenty-four local currency markets. This multi-currency benchmark includes treasury, government-related, corporate and securitized fixed-rate bonds from both developed and emerging markets issuers. An investor cannot invest directly in an index. The volatility of the benchmark may be materially different from the individual performance obtained by a specific investor.
The ICE Exchange-Listed Fixed & Adjustable Rate Preferred Securities Index is a modified market capitalization weighted index composed of preferred stock and securities that are functionally equivalent to preferred stock including, but not limited to, depositary preferred securities, perpetual subordinated debt and certain securities issued by banks and other financial institutions that are eligible for capital treatment with respect to such instruments akin to that received for issuance of straight preferred stock. An investor cannot invest directly in an index. The volatility of the benchmark may be materially different from the individual performance obtained by a specific investor.
The CBOE Volatility Index (VIX) is a calculation designed to produce a measure of constant, 30-day expected volatility of the U.S. stock market, derived from real-time, mid-quote prices of S&P 500 Index call and put options. On a global basis, it is one of the most recognized measures of volatility — widely reported by financial media and closely followed by a variety of market participants as a daily market indicator. The volatility of the benchmark may be materially different from the individual performance obtained by a specific investor. An investor cannot invest directly in an index. The NASDAQ-100 Index includes 100 of the largest domestic and international non-financial companies listed on The NASDAQ Stock Market based on market capitalization. The Index reflects companies across major industry groups including computer hardware and software, telecommunications, retail/wholesale trade and biotechnology. Index composition is reviewed on an annual basis in December. An investor cannot invest directly in an index.