
The U.S. made an announcement on the global stage that sent the media into a tizzy and financial markets into heightened downside volatility. Investors were left guessing what might come next, and how long the uncertainty would last. Was this the beginning of drawn-out tensions on the global stage? Would a recession and/or bear market follow?
I’m not describing the recent escalation in the Middle East. I’m thinking back to almost exactly one year ago, when sweeping tariff announcements triggered a sharp market selloff and a wave of pessimism about global growth. Investors likely remember how sharply the equity markets initially reacted. Global equities fell roughly -11% in a matter of days.
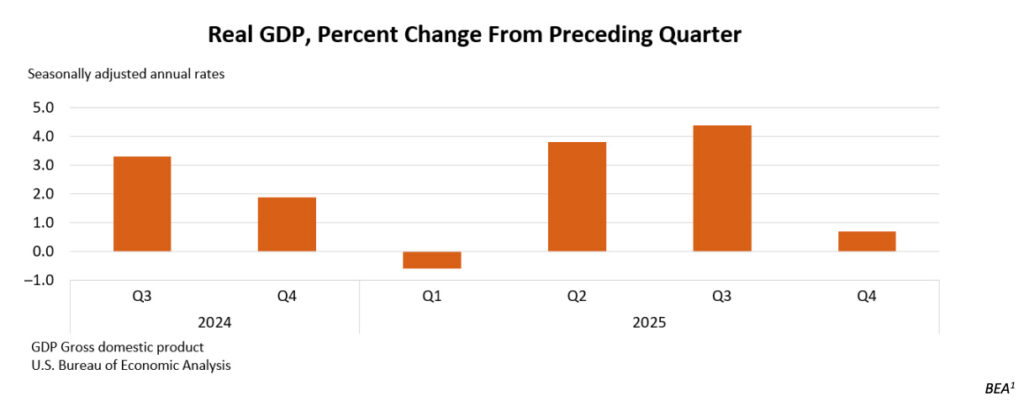
But the reaction didn’t last long, and we didn’t see a bear market or a recession last year. One could argue that 2025 delivered the opposite. The S&P 500 rose nearly +18% in 2025, while the U.S. economy accelerated into the third quarter, finishing the year with modest but positive GDP growth.
What is critical for investors to remember, in my view, is that tariff headlines and trade tensions did not necessarily let up as the year went on. It would be hard to argue that we ever got ‘certainty’ on trade policy in 2025. We didn’t. But markets did not wait for trade deals to be finalized, for tariffs to be rolled back, or for uncertainty to disappear. Stocks adjusted expectations quickly and moved on.
Last year’s tariff case study underscores what I mean by ‘the cost of headline-driven decision making.’ With the current war in Iran, timing the announcement of a two-week cease-fire may have looked like a great trade on paper, but I think the smarter money would have avoided the short-term volatility altogether. As last year’s tariff episode reminds us, markets can remain very choppy in an hour-to-hour news cycle, and it’s easy for investors to get baited into changing course quickly—which can mean failing to fully participate in the longer-term recovery.
In my view, the same dynamic is at play today. Markets are once again being driven by a steady stream of headlines, only this time it’s centered on geopolitical risk, energy supply, and the Strait of Hormuz. Investors are left trying to assess not just what is happening, but how long it will last and what it means for markets.
Equities are responding in real time, but the price action is not as severe as it was last year. It’s also true that the U.S. has fared far better than international markets over the past several weeks. The U.S. is far less exposed to rising energy costs than many of its global peers, given its role as a major oil and natural gas producer. By contrast, regions like Europe remain heavily reliant on imported energy. Estimates suggest that oil and LNG imports account for roughly 1% to 2% of eurozone GDP, compared to a modest positive contribution from net energy exports in the U.S.2
This isn’t a call to favor U.S. over foreign stocks on this headline alone. It is simply a reminder that the economic consequences of a prolonged conflict are unlikely to fall evenly across regions, and that higher energy prices do not automatically translate into broad-based weakness in the U.S. economy.
If last year’s tariff episode taught investors anything, it is that markets do not wait for resolution. They adjust to the range of possible outcomes quickly, and they often move on well before the news flow improves or the uncertainty fully clears. The same may be true here. By the time this conflict feels more settled and the outlook appears clearer, markets may have already done much of their repricing. The two-week cease-fire may hold, and it may not. Investors would be better served looking further out on the horizon, in my view.
Bottom Line for Investors
The real risk in environments like this isn’t the market volatility itself. It’s how investors respond. Periods driven by macro headlines can create the illusion that action is required, whether that means buying into weakness or pulling back until uncertainty fades. But last year’s tariff episode showed how unreliable that instinct can be. The most significant market moves often occur before the news flow improves, not after.
That’s why trying to position around how geopolitical events unfold is rarely productive. It requires getting both the outcome and the timing right, which is simply not possible without a great deal
1 BEA. 2026. https://www.bea.gov/system/files/gdp4q25-2nd-chart-01.png
2 Wall Street Journal. April 4, 2026. https://advisor.zacksim.com/e/376582/-mod-economy-feat1-global-pos2/5vbfv7/1508659551/h/9XYSbfdZsg3fDfMt7mtAz1z8jVNLpHqtRgZFJVGJpkg
DISCLOSURE
Past performance is no guarantee of future results. Inherent in any investment is the potential for loss.
Zacks Investment Management, Inc. is a wholly-owned subsidiary of Zacks Investment Research. Zacks Investment Management is an independent Registered Investment Advisory firm and acts as an investment manager for individuals and institutions. Zacks Investment Research is a provider of earnings data and other financial data to institutions and to individuals.
This material is being provided for informational purposes only and nothing herein constitutes investment, legal, accounting or tax advice, or a recommendation to buy, sell or hold a security. Do not act or rely upon the information and advice given in this publication without seeking the services of competent and professional legal, tax, or accounting counsel. Publication and distribution of this article is not intended to create, and the information contained herein does not constitute, an attorney-client relationship. No recommendation or advice is being given as to whether any investment or strategy is suitable for a particular investor. It should not be assumed that any investments in securities, companies, sectors or markets identified and described were or will be profitable. All information is current as of the date of herein and is subject to change without notice. Any views or opinions expressed may not reflect those of the firm as a whole.
Any projections, targets, or estimates in this report are forward looking statements and are based on the firm’s research, analysis, and assumptions. Due to rapidly changing market conditions and the complexity of investment decisions, supplemental information and other sources may be required to make informed investment decisions based on your individual investment objectives and suitability specifications. All expressions of opinions are subject to change without notice. Clients should seek financial advice regarding the appropriateness of investing in any security or investment strategy discussed in this presentation.
Certain economic and market information contained herein has been obtained from published sources prepared by other parties. Zacks Investment Management does not assume any responsibility for the accuracy or completeness of such information. Further, no third party has assumed responsibility for independently verifying the information contained herein and accordingly no such persons make any representations with respect to the accuracy, completeness or reasonableness of the information provided herein. Unless otherwise indicated, market analysis and conclusions are based upon opinions or assumptions that Zacks Investment Management considers to be reasonable. Any investment inherently involves a high degree of risk, beyond any specific risks discussed herein.
The S&P 500 Index is a well-known, unmanaged index of the prices of 500 large-company common stocks, mainly blue-chip stocks, selected by Standard & Poor’s. The S&P 500 Index assumes reinvestment of dividends but does not reflect advisory fees. The volatility of the benchmark may be materially different from the individual performance obtained by a specific investor. An investor cannot invest directly in an index.
The Russell 1000 Growth Index is a well-known, unmanaged index of the prices of 1000 large-company growth common stocks selected by Russell. The Russell 1000 Growth Index assumes reinvestment of dividends but does not reflect advisory fees. An investor cannot invest directly in an index. The volatility of the benchmark may be materially different from the individual performance obtained by a specific investor.
Nasdaq Composite Index is the market capitalization-weighted index of over 3,300 common equities listed on the Nasdaq stock exchange. The types of securities in the index include American depositary receipts, common stocks, real estate investment trusts (REITs) and tracking stocks, as well as limited partnership interests. The index includes all Nasdaq-listed stocks that are not derivatives, preferred shares, funds, exchange-traded funds (ETFs) or debenture securities. An investor cannot invest directly in an index. The volatility of the benchmark may be materially different from the individual performance obtained by a specific investor.
The Dow Jones Industrial Average measures the daily stock market movements of 30 U.S. publicly-traded companies listed on the NASDAQ or the New York Stock Exchange (NYSE). The 30 publicly-owned companies are considered leaders in the United States economy. An investor cannot directly invest in an index. The volatility of the benchmark may be materially different from the individual performance obtained by a specific investor.
The Bloomberg Global Aggregate Index is a flagship measure of global investment grade debt from twenty-four local currency markets. This multi-currency benchmark includes treasury, government-related, corporate and securitized fixed-rate bonds from both developed and emerging markets issuers. An investor cannot invest directly in an index. The volatility of the benchmark may be materially different from the individual performance obtained by a specific investor.
The ICE Exchange-Listed Fixed & Adjustable Rate Preferred Securities Index is a modified market capitalization weighted index composed of preferred stock and securities that are functionally equivalent to preferred stock including, but not limited to, depositary preferred securities, perpetual subordinated debt and certain securities issued by banks and other financial institutions that are eligible for capital treatment with respect to such instruments akin to that received for issuance of straight preferred stock. An investor cannot invest directly in an index. The volatility of the benchmark may be materially different from the individual performance obtained by a specific investor.
The MSCI ACWI ex U.S. Index captures large and mid-cap representation across 22 of 23 Developed Markets (DM) countries (excluding the United States) and 24 Emerging Markets (EM) countries. The index covers approximately 85% of the global equity opportunity set outside the U.S. An investor cannot invest directly in an index. The volatility of the benchmark may be materially different from the individual performance obtained by a specific investor.
The Russell 2000 Index is a well-known, unmanaged index of the prices of 2000 small-cap company common stocks, selected by Russell. The Russell 2000 Index assumes reinvestment of dividends but does not reflect advisory fees. An investor cannot invest directly in an index. The volatility of the benchmark may be materially different from the individual performance obtained by a specific investor.
The S&P Mid Cap 400 provides investors with a benchmark for mid-sized companies. The index, which is distinct from the large-cap S&P 500, is designed to measure the performance of 400 mid-sized companies, reflecting the distinctive risk and return characteristics of this market segment.
The S&P 500 Pure Value index is a style-concentrated index designed to track the performance of stocks that exhibit the strongest value characteristics by using a style-attractiveness-weighting scheme. An investor cannot directly invest in an index. The volatility of the benchmark may be materially different from the individual performance obtained by a specific investor.