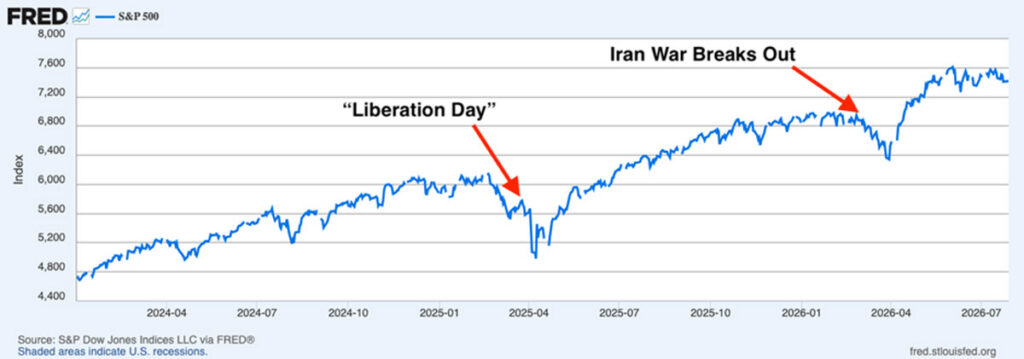
On April 2, 2025 (“Liberation Day”), the Trump administration announced sweeping, ‘reciprocal’ tariffs, and readers likely recall that the initial market reaction was swift and negative. Investors immediately tried to price in worst-case scenarios like higher import costs, pressure on profit margins, slower growth, renewed inflation, and a more complicated path for interest rates.
The conflict involving Iran followed a similar pattern. The initial reaction was sharp, with the S&P 500 nearly reaching correction territory in March. In that instance, investors were pricing-in fears about energy supply, inflation, and higher interest rates.
In both cases, the short-term market reaction was driven by uncertainty, understandably. But we now know that the longer-term response was driven by fundamentals, which remained strong despite these pressures. The S&P 500 rose nearly 18% in 2025 and gained another 10% in the first half of 2026.
The S&P 500 Absorbed Tariff and War Shocks Quickly, Then Continued to Rise (2024 – Present)
Source: Federal Reserve Bank of St. Louis 1
As we enter the second half of 2026, the tariff and war risks are back on the table, with one difference: the market has already spent the past year pricing, testing, and reassessing both risks in real time.
On the tariff side, we’ve seen an additional 50% tariff on a range of Canadian goods, including wine, alcoholic beverages, hockey sticks, cement, and other products. This comes on top of a broader tariff stack that includes duties on Chinese goods, non-USMCA Mexican products, European Union goods, semiconductors, and a proposed tariff (10% – 12.5%) tied to forced-labor concerns across dozens of countries.
I continue to believe that tariffs are not positive for the economy, as they raise costs, create uncertainty for businesses, and can pressure margins for companies with global supply chains or limited pricing power. But they are also no longer a brand-new shock.
When tariffs were first announced in 2025, investors had to consider a wide range of unknowns. Would companies pass the cost on to consumers? Would inflation reaccelerate? Would profit margins compress? Would trade partners retaliate in a way that disrupted global growth?
Investors now know the answers to most of those questions, with the bottom line being that corporate earnings proved more resilient than many feared. The result was not painless, but it also was not the market-breaking event many feared when the policy was first announced.
The renewed conflict involving Iran is similar. It remains a near-term risk because of its potential effects on energy supply, inflation, and interest rates. Earlier this year, investors entered the quarter with oil prices sharply higher and uncertainty surrounding transit through the Strait of Hormuz. But as the quarter progressed, the most severe market assumptions receded. Brent crude fell nearly 40% from its April peak, and oil exports from the Persian Gulf recovered to approximately 60% of their pre-war level.
With the conflict back on, Brent crude is near $90 per barrel, and Gulf transit has become volatile again, with some July days seeing only a fraction of normal vessel traffic through the Strait of Hormuz. While this is not a risk investors should dismiss, the market has seen this pattern before: escalation pushes oil prices higher, inflation expectations rise, bond yields tick higher, and investors reduce expectations for monetary easing. But when energy flows stabilize, much of that pricing can reverse quickly.
The potential consequences of renewed conflict are serious, but the channels through which it affects the economy are increasingly well understood. The same is true for tariffs. Both can still create volatility, but they likely need to worsen, broaden, or surprise markets in a new way to create lasting damage. And I don’t see that happening here.
Bottom Line for Investors
Tariffs and war are not good news, and neither should be ignored. Both can affect prices, margins, interest rates, energy markets, and investor confidence.
But these are no longer entirely new risks. Investors have already seen both issues play out in real time, and the worst-case, long-term market assumptions did not materialize. Volatility remains a distinct possibility, sure. But in my view, unless tariffs or the Iran conflict produce a new and more damaging economic surprise, the more important drivers for investors are still likely to be economic and corporate earnings fundamentals—both of which remain strong.
1 Fred Economic Data. July 28, 2026. https://advisor.zacksim.com/e/376582/series-SP500/5vpynx/1578235974/h/5Zltz33BeMCqHvx_Ik1Tyq9iDVVxJDUEvueQEc0_ENs
DISCLOSURE
Past performance is no guarantee of future results. Inherent in any investment is the potential for loss.
Zacks Investment Management, Inc. is a wholly-owned subsidiary of Zacks Investment Research. Zacks Investment Management is an independent Registered Investment Advisory firm and acts as an investment manager for individuals and institutions. Zacks Investment Research is a provider of earnings data and other financial data to institutions and to individuals.
This material is being provided for informational purposes only and nothing herein constitutes investment, legal, accounting or tax advice, or a recommendation to buy, sell or hold a security. Do not act or rely upon the information and advice given in this publication without seeking the services of competent and professional legal, tax, or accounting counsel. Publication and distribution of this article is not intended to create, and the information contained herein does not constitute, an attorney-client relationship. No recommendation or advice is being given as to whether any investment or strategy is suitable for a particular investor. It should not be assumed that any investments in securities, companies, sectors or markets identified and described were or will be profitable. All information is current as of the date of herein and is subject to change without notice. Any views or opinions expressed may not reflect those of the firm as a whole.
Any projections, targets, or estimates in this report are forward looking statements and are based on the firm’s research, analysis, and assumptions. Due to rapidly changing market conditions and the complexity of investment decisions, supplemental information and other sources may be required to make informed investment decisions based on your individual investment objectives and suitability specifications. All expressions of opinions are subject to change without notice. Clients should seek financial advice regarding the appropriateness of investing in any security or investment strategy discussed in this presentation.
Certain economic and market information contained herein has been obtained from published sources prepared by other parties. Zacks Investment Management does not assume any responsibility for the accuracy or completeness of such information. Further, no third party has assumed responsibility for independently verifying the information contained herein and accordingly no such persons make any representations with respect to the accuracy, completeness or reasonableness of the information provided herein. Unless otherwise indicated, market analysis and conclusions are based upon opinions or assumptions that Zacks Investment Management considers to be reasonable.
The S&P 500 Index is a well-known, unmanaged index of the prices of 500 large-company common stocks, mainly blue-chip stocks, selected by Standard & Poor’s. The S&P 500 Index assumes reinvestment of dividends but does not reflect advisory fees. The volatility of the benchmark may be materially different from the individual performance obtained by a specific investor. An investor cannot invest directly in an index.
The Nasdaq Composite Index measures all Nasdaq domestic and international based common type stocks listed on The Nasdaq Stock Market. To be eligible for inclusion in the Index, the security’s U.S. listing must be exclusively on The Nasdaq Stock Market (unless the security was dually listed on another U.S. market prior to January 1, 2004 and has continuously maintained such listing). The security types eligible for the Index include common stocks, ordinary shares, ADRs, shares of beneficial interest or limited partnership interests and tracking stocks. Security types not included in the Index are closed-end funds, convertible debentures, exchange traded funds, preferred stocks, rights, warrants, units and other derivative securities. An investor cannot invest directly in an index.
The PHLX Semiconductor Sector Index is designed to track the performance of a set of companies engaged in the design, distribution, manufacture, and sale of semiconductors. An investor cannot invest directly in an index. The volatility of the benchmark may be materially different from the individual performance obtained by a specific investor.
Questions posed are for demonstrative and informational purposes only and may not reflect the views of current clients or any one individual.
Any investment inherently involves a high degree of risk, beyond any specific risks discussed herein.
Copyright © 2026. All rights reserved.