Categorizing a Market Selloff Can Help You Navigate It
Market declines come in all shapes and sizes, but they tend to follow similar patterns over time. Corrections are short, sharp declines between -10% and -20%, while bear markets are declines greater than 20% that fall into one of three categories1:
· Structural – These bear markets are caused by severe dislocations, typically in financial markets, and are often associated with ‘bubbles.’ The 2008 Global Financial Crisis is an example of a structural bear, which often take several years to fully recover from.
· Cyclical – These bear markets are more closely tied to the business cycle, and often coincide with a peak in profit margins, rising interest rates, elevated inflation, and/or a deceleration in economic growth.
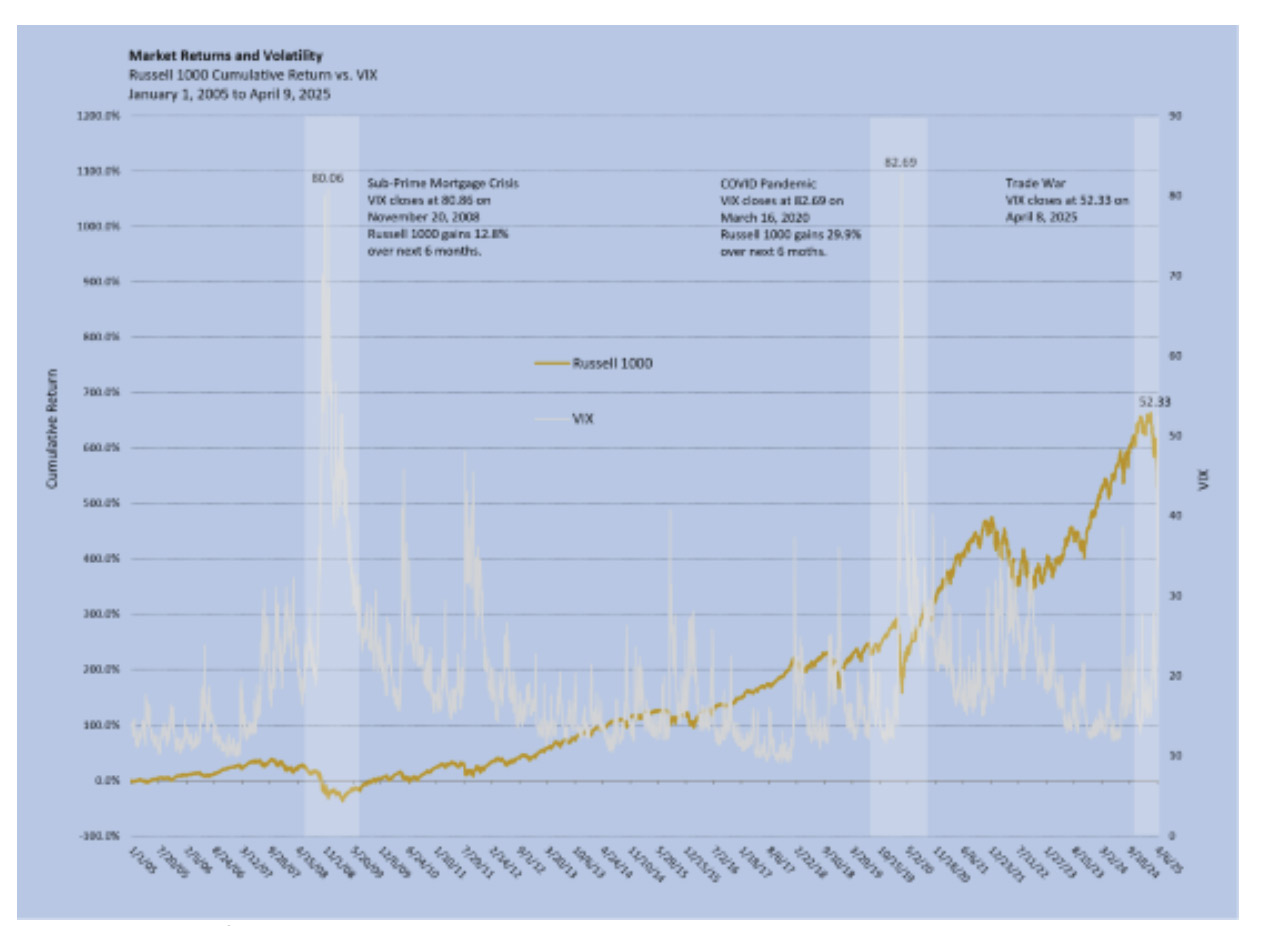
· Event-Driven – Event-driven bear markets are triggered by an extraneous, usually unexpected shock. The Covid-19 pandemic is a perfect example of an event-driven bear market, as investors quickly anticipate immediate and elevated risks to earnings and growth.
In terms of magnitude and duration, structural bear markets tend to be the most painful. They’ve averaged about -37% declines over approximately 42 months. Cyclical and event-driven bear markets, on the other hand, average about -30% declines over generally shorter periods. Cyclical bears have lasted 25 months on average, while event-driven bears have usually spanned about 8 months with an average drawdown of -29%.
In my view, the current environment has the markings of a correction or an event-driven bear market.
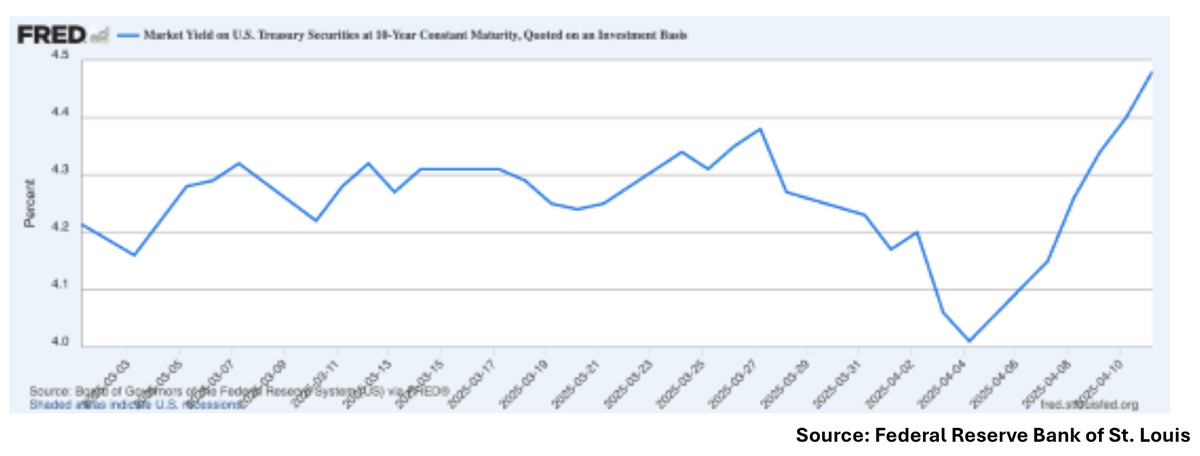
The stock market appears to be very quickly pricing-in uncertainty tied to tariffs and other political factors, which has led to multiple contractions even as earnings have, to date, held up reasonably well. I’m not seeing any signs of a bubble bursting or a crisis in financial markets, which I think easily rules out a structural bear. A cyclical bear market does not seem likely either, as interest rates and inflation peaked some time ago and earnings expectations for 2025 were nicely positive throughout Q1. Higher-than-expected tariff pronouncements—with all the accompanying uncertainty—have been the wild card, which I think puts this downdraft in the event-driven category.
As seen in the table below, event-driven bear markets can sometimes have the look and feel of corrections, given the very short time frame where downside volatility is experienced. Once the downdraft is over, the forward returns are unanimously positive.
Bear Markets and Recoveries, 1929 – Present

It makes sense why the recovery from event-driven downdrafts is often quick. In many cases, the global/U.S. economy is in decent or good shape before an exogenous event takes place, meaning that it does not take quite as long for the economy to recover once the impact of the ‘event’ fades. In the current environment, if trade uncertainty suddenly fades it would be easy to envision the market taking off in response. U.S. household and corporate balance sheets are strong, the jobs market remains in strong overall shape, and credit spreads are tight. Investment-grade corporations still have relatively easy access to capital markets, and banks are also very well capitalized. This calls for patience, in my view.
Bottom Line for Investors
There is no way to know when the market will bottom. But what I can tell you, from a long reading of history, is that a sustained market rally will almost certainly take hold as the news remains bad and even gets worse. In other words, don’t wait for the breakthrough in trade.
The goal now is to ensure you’re positioned to participate in the rebound when it occurs. If this is a correction or an event-driven bear market, which I believe it is, that rebound could arrive much sooner than many anticipate.
1 Goldman Sachs. Asset Management. 2025.
DISCLOSURE
Past performance is no guarantee of future results. Inherent in any investment is the potential for loss.
Zacks Investment Management, Inc. is a wholly-owned subsidiary of Zacks Investment Research. Zacks Investment Management is an independent Registered Investment Advisory firm and acts as an investment manager for individuals and institutions. Zacks Investment Research is a provider of earnings data and other financial data to institutions and to individuals.
This material is being provided for informational purposes only and nothing herein constitutes investment, legal, accounting or tax advice, or a recommendation to buy, sell or hold a security. Do not act or rely upon the information and advice given in this publication without seeking the services of competent and professional legal, tax, or accounting counsel. Publication and distribution of this article is not intended to create, and the information contained herein does not constitute, an attorney-client relationship. No recommendation or advice is being given as to whether any investment or strategy is suitable for a particular investor. It should not be assumed that any investments in securities, companies, sectors or markets identified and described were or will be profitable. All information is current as of the date of herein and is subject to change without notice. Any views or opinions expressed may not reflect those of the firm as a whole.
Any projections, targets, or estimates in this report are forward looking statements and are based on the firm’s research, analysis, and assumptions. Due to rapidly changing market conditions and the complexity of investment decisions, supplemental information and other sources may be required to make informed investment decisions based on your individual investment objectives and suitability specifications. All expressions of opinions are subject to change without notice. Clients should seek financial advice regarding the appropriateness of investing in any security or investment strategy discussed in this presentation.
Certain economic and market information contained herein has been obtained from published sources prepared by other parties. Zacks Investment Management does not assume any responsibility for the accuracy or completeness of such information. Further, no third party has assumed responsibility for independently verifying the information contained herein and accordingly no such persons make any representations with respect to the accuracy, completeness or reasonableness of the information provided herein. Unless otherwise indicated, market analysis and conclusions are based upon opinions or assumptions that Zacks Investment Management considers to be reasonable. Any investment inherently involves a high degree of risk, beyond any specific risks discussed herein.
The S&P 500 Index is a well-known, unmanaged index of the prices of 500 large-company common stocks, mainly blue-chip stocks, selected by Standard & Poor’s. The S&P 500 Index assumes reinvestment of dividends but does not reflect advisory fees. The volatility of the benchmark may be materially different from the individual performance obtained by a specific investor. An investor cannot invest directly in an index.
The Russell 1000 Growth Index is a well-known, unmanaged index of the prices of 1000 large-company growth common stocks selected by Russell. The Russell 1000 Growth Index assumes reinvestment of dividends but does not reflect advisory fees. An investor cannot invest directly in an index. The volatility of the benchmark may be materially different from the individual performance obtained by a specific investor.
Nasdaq Composite Index is the market capitalization-weighted index of over 3,300 common equities listed on the Nasdaq stock exchange. The types of securities in the index include American depositary receipts, common stocks, real estate investment trusts (REITs) and tracking stocks, as well as limited partnership interests. The index includes all Nasdaq-listed stocks that are not derivatives, preferred shares, funds, exchange-traded funds (ETFs) or debenture securities. An investor cannot invest directly in an index. The volatility of the benchmark may be materially different from the individual performance obtained by a specific investor.
The Dow Jones Industrial Average measures the daily stock market movements of 30 U.S. publicly-traded companies listed on the NASDAQ or the New York Stock Exchange (NYSE). The 30 publicly-owned companies are considered leaders in the United States economy. An investor cannot directly invest in an index. The volatility of the benchmark may be materially different from the individual performance obtained by a specific investor.
The Bloomberg Global Aggregate Index is a flagship measure of global investment grade debt from twenty-four local currency markets. This multi-currency benchmark includes treasury, government-related, corporate and securitized fixed-rate bonds from both developed and emerging markets issuers. An investor cannot invest directly in an index. The volatility of the benchmark may be materially different from the individual performance obtained by a specific investor.
The ICE Exchange-Listed Fixed & Adjustable Rate Preferred Securities Index is a modified market capitalization weighted index composed of preferred stock and securities that are functionally equivalent to preferred stock including, but not limited to, depositary preferred securities, perpetual subordinated debt and certain securities issued by banks and other financial institutions that are eligible for capital treatment with respect to such instruments akin to that received for issuance of straight preferred stock. An investor cannot invest directly in an index. The volatility of the benchmark may be materially different from the individual performance obtained by a specific investor.
The MSCI ACWI ex U.S. Index captures large and mid-cap representation across 22 of 23 Developed Markets (DM) countries (excluding the United States) and 24 Emerging Markets (EM) countries. The index covers approximately 85% of the global equity opportunity set outside the U.S. An investor cannot invest directly in an index. The volatility of the benchmark may be materially different from the individual performance obtained by a specific investor.
The Russell 2000 Index is a well-known, unmanaged index of the prices of 2000 small-cap company common stocks, selected by Russell. The Russell 2000 Index assumes reinvestment of dividends but does not reflect advisory fees. An investor cannot invest directly in an index. The volatility of the benchmark may be materially different from the individual performance obtained by a specific investor.
The S&P Mid Cap 400 provides investors with a benchmark for mid-sized companies. The index, which is distinct from the large-cap S&P 500, is designed to measure the performance of 400 mid-sized companies, reflecting the distinctive risk and return characteristics of this market segment.
The S&P 500 Pure Value index is a style-concentrated index designed to track the performance of stocks that exhibit the strongest value characteristics by using a style-attractiveness-weighting scheme. An investor cannot directly invest in an index. The volatility of the benchmark may be materially different from the individual performance obtained by a specific investor.