What Does the U.S. Credit Rating Downgrade Mean for Investors?
Another ratings agency has downgraded the U.S. government.
Last Friday, Moody’s became the third and final agency to strip the U.S. of its AAA credit rating, following earlier downgrades by S&P in 2011 and Fitch in 2023. Moody’s cited a persistent and widening fiscal deficit, along with the compounding effects of elevated interest costs, as the primary drivers of its decision. According to the agency, “successive U.S. administrations and Congress have failed to agree on measures to reverse the trend of large annual fiscal deficits and growing interest costs.”1
In other words, Moody’s is telling us something we’ve already known for decades.
The reasons Fitch and S&P gave for their downgrades largely mirrored Moody’s reasoning: too much spending, too little revenue, and too little cooperation in Congress to fix the issue. Put another way, ratings agencies give us a reflection of the state of affairs, but they are by no means leading indicators. After all, as seen in the chart below, the U.S. government has only managed to run four budget surpluses in the last 50+ years. The downgrade might be news, but the issue isn’t.
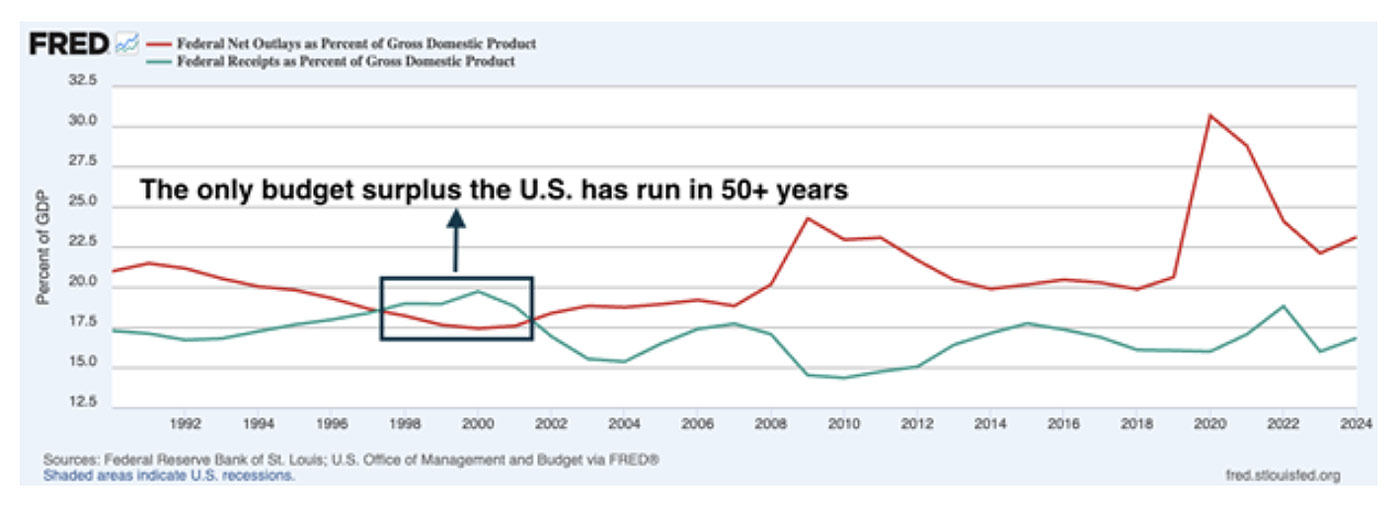
Source: Federal Reserve Bank of St. Louis2
Not only do ratings changes tend to be lagging indicators, but there’s also a long history of ratings missteps over the years. Perhaps the biggest in history came from the 2001 Enron scandal, where the rating agencies didn’t downgrade the company until just days before its collapse. There’s also the fact that S&P agreed to pay a $1.5 billion penalty for failing to assess the exorbitant risks present in the subprime mortgage CDO market leading up to the 2008 Global Financial Crisis—a huge miss.
Ratings downgrades would matter greatly if they resulted in surging Treasury bond yields, i.e., if they made it more expensive for the U.S. to borrow. But that has not been the case historically. As seen in the chart below, when S&P downgraded U.S. debt in 2011, the 10-year U.S. Treasury bond yield was at roughly 2.5%. It finished the decade below 2%.
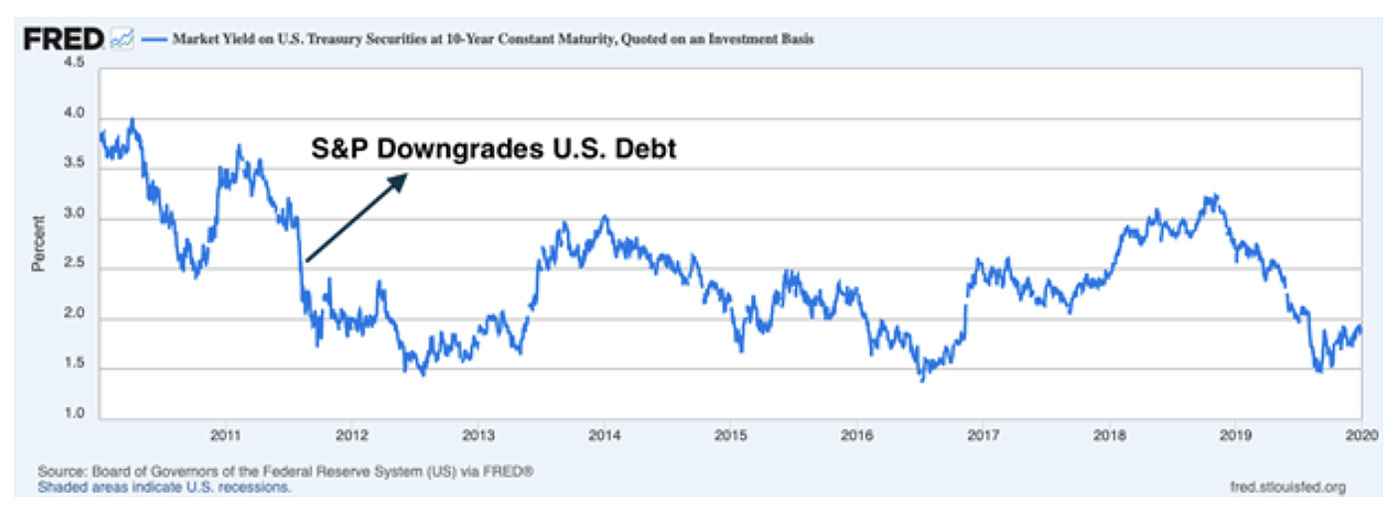
Source: Federal Reserve Bank of St. Louis3
Ultimately, bond investors aren’t focused on letter grades—they’re focused on whether they’ll get their money back, with interest. From that lens, the U.S. remains one of the most reliable borrowers in the world. What matters isn’t the absolute size of U.S. debt, but its ability to service that debt. And right now, annual federal tax revenues far exceed interest payments, underscoring our ability to never miss a debt payment. Add to that the global demand for dollar-denominated assets and the sheer scale and diversity of the U.S. economy, and it becomes clear why Treasurys still sit at the center of global finance.
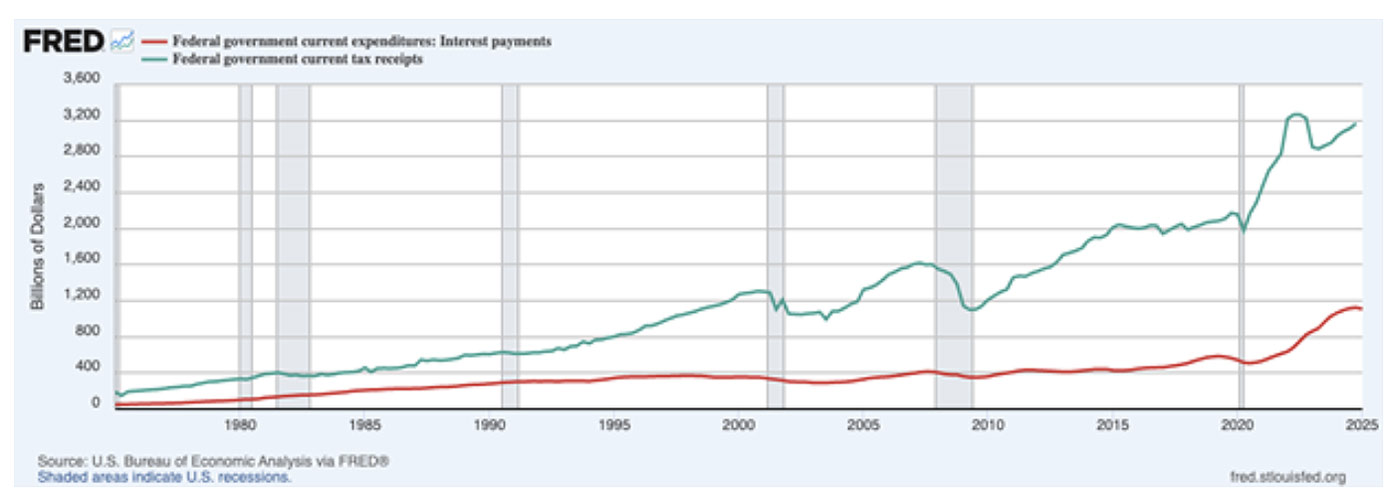
Source: Federal Reserve Bank of St. Louis4
It is important for me to make a distinction in my argument here, however. While I think a ratings downgrade a notch lower from AAA does not have many investment implications, I do believe the long-term issue of consistent deficit spending can and will have negative economic effects if it persists.
One key concern is the crowding-out effect. When the government runs large deficits, it typically funds them by issuing more debt. As federal borrowing ramps up, it can absorb a greater share of available capital in the economy, leaving less for private-sector investment. That shift can hinder the growth of businesses, limit innovation, and reduce long-term productivity.
Additionally, as debt servicing consumes a larger slice of the federal budget, it can constrain fiscal flexibility. Dollars spent on interest payments are dollars not spent on infrastructure, education, or other areas that support long-term economic health. Over time, if this dynamic continues unchecked, it can dampen potential GDP growth and erode investor confidence in U.S. policymaking—even if default risk remains low.
Bottom Line for Investors
Investors shouldn’t view the downgrade as an urgent alarm bell. But we should also not ignore the broader message. While Moody’s isn’t telling us anything new, the ratings downgrade does reinforce a longer-term concern: persistent fiscal imbalances. If left unaddressed, this can become a drag on economic growth. The risk isn’t about an imminent inability to pay—Treasury interest payments remain well covered by tax revenues—but about the cumulative effect of rising debt and interest costs over time.
If deficits continue to widen and debt service takes up a growing share of federal resources, it could begin to crowd out productive private investment, strain fiscal flexibility, and gradually undermine the foundations of U.S. economic leadership. In that sense, the downgrade is less a shock event and more a warning sign for policymakers on the road ahead.
These are the views of the author, not the named Representative or Advisory Services Network, LLC, and should not be construed as investment advice. Neither the named Representative nor Advisory Services Network, LLC gives tax or legal advice. All information is believed to be from reliable sources; however, we make no representation as to its completeness or accuracy. Please consult your Financial Advisor for further information.
1 Wall Street Journal. May 16, 2025. https://advisor.zacksim.com/e/376582/omy-feat1-central-banking-pos1/5t1vsr/1232662594/h/wov49SFzU8_c9KxPDfp_Fw0CxoNcRBvYYfXWNcDz-68
2 Fred Economic Data. May 27, 2025. https://advisor.zacksim.com/e/376582/series-FYONGDA188S/5t1vsv/1232662594/h/wov49SFzU8_c9KxPDfp_Fw0CxoNcRBvYYfXWNcDz-68
3 Fred Economic Data. May 20, 2025. https://advisor.zacksim.com/e/376582/series-DGS10-/5t1vsy/1232662594/h/wov49SFzU8_c9KxPDfp_Fw0CxoNcRBvYYfXWNcDz-68
4 Fred Economic Data. April 30, 2025. https://advisor.zacksim.com/e/376582/series-A091RC1Q027SBEA-/5t1vt5/1232662594/h/wov49SFzU8_c9KxPDfp_Fw0CxoNcRBvYYfXWNcDz-68
DISCLOSURE
Past performance is no guarantee of future results. Inherent in any investment is the potential for loss.
Zacks Investment Management, Inc. is a wholly-owned subsidiary of Zacks Investment Research. Zacks Investment Management is an independent Registered Investment Advisory firm and acts as an investment manager for individuals and institutions. Zacks Investment Research is a provider of earnings data and other financial data to institutions and to individuals.
This material is being provided for informational purposes only and nothing herein constitutes investment, legal, accounting or tax advice, or a recommendation to buy, sell or hold a security. Do not act or rely upon the information and advice given in this publication without seeking the services of competent and professional legal, tax, or accounting counsel. Publication and distribution of this article is not intended to create, and the information contained herein does not constitute, an attorney-client relationship. No recommendation or advice is being given as to whether any investment or strategy is suitable for a particular investor. It should not be assumed that any investments in securities, companies, sectors or markets identified and described were or will be profitable. All information is current as of the date of herein and is subject to change without notice. Any views or opinions expressed may not reflect those of the firm as a whole.
Any projections, targets, or estimates in this report are forward looking statements and are based on the firm’s research, analysis, and assumptions. Due to rapidly changing market conditions and the complexity of investment decisions, supplemental information and other sources may be required to make informed investment decisions based on your individual investment objectives and suitability specifications. All expressions of opinions are subject to change without notice. Clients should seek financial advice regarding the appropriateness of investing in any security or investment strategy discussed in this presentation.
Certain economic and market information contained herein has been obtained from published sources prepared by other parties. Zacks Investment Management does not assume any responsibility for the accuracy or completeness of such information. Further, no third party has assumed responsibility for independently verifying the information contained herein and accordingly no such persons make any representations with respect to the accuracy, completeness or reasonableness of the information provided herein. Unless otherwise indicated, market analysis and conclusions are based upon opinions or assumptions that Zacks Investment Management considers to be reasonable. Any investment inherently involves a high degree of risk, beyond any specific risks discussed herein.
The S&P 500 Index is a well-known, unmanaged index of the prices of 500 large-company common stocks, mainly blue-chip stocks, selected by Standard & Poor’s. The S&P 500 Index assumes reinvestment of dividends but does not reflect advisory fees. The volatility of the benchmark may be materially different from the individual performance obtained by a specific investor. An investor cannot invest directly in an index.
The Russell 1000 Growth Index is a well-known, unmanaged index of the prices of 1000 large-company growth common stocks selected by Russell. The Russell 1000 Growth Index assumes reinvestment of dividends but does not reflect advisory fees. An investor cannot invest directly in an index. The volatility of the benchmark may be materially different from the individual performance obtained by a specific investor.
Nasdaq Composite Index is the market capitalization-weighted index of over 3,300 common equities listed on the Nasdaq stock exchange. The types of securities in the index include American depositary receipts, common stocks, real estate investment trusts (REITs) and tracking stocks, as well as limited partnership interests. The index includes all Nasdaq-listed stocks that are not derivatives, preferred shares, funds, exchange-traded funds (ETFs) or debenture securities. An investor cannot invest directly in an index. The volatility of the benchmark may be materially different from the individual performance obtained by a specific investor.
The Dow Jones Industrial Average measures the daily stock market movements of 30 U.S. publicly-traded companies listed on the NASDAQ or the New York Stock Exchange (NYSE). The 30 publicly-owned companies are considered leaders in the United States economy. An investor cannot directly invest in an index. The volatility of the benchmark may be materially different from the individual performance obtained by a specific investor.
The Bloomberg Global Aggregate Index is a flagship measure of global investment grade debt from twenty-four local currency markets. This multi-currency benchmark includes treasury, government-related, corporate and securitized fixed-rate bonds from both developed and emerging markets issuers. An investor cannot invest directly in an index. The volatility of the benchmark may be materially different from the individual performance obtained by a specific investor.
The ICE Exchange-Listed Fixed & Adjustable Rate Preferred Securities Index is a modified market capitalization weighted index composed of preferred stock and securities that are functionally equivalent to preferred stock including, but not limited to, depositary preferred securities, perpetual subordinated debt and certain securities issued by banks and other financial institutions that are eligible for capital treatment with respect to such instruments akin to that received for issuance of straight preferred stock. An investor cannot invest directly in an index. The volatility of the benchmark may be materially different from the individual performance obtained by a specific investor.
The MSCI ACWI ex U.S. Index captures large and mid-cap representation across 22 of 23 Developed Markets (DM) countries (excluding the United States) and 24 Emerging Markets (EM) countries. The index covers approximately 85% of the global equity opportunity set outside the U.S. An investor cannot invest directly in an index. The volatility of the benchmark may be materially different from the individual performance obtained by a specific investor.
The Russell 2000 Index is a well-known, unmanaged index of the prices of 2000 small-cap company common stocks, selected by Russell. The Russell 2000 Index assumes reinvestment of dividends but does not reflect advisory fees. An investor cannot invest directly in an index. The volatility of the benchmark may be materially different from the individual performance obtained by a specific investor.
The S&P Mid Cap 400 provides investors with a benchmark for mid-sized companies. The index, which is distinct from the large-cap S&P 500, is designed to measure the performance of 400 mid-sized companies, reflecting the distinctive risk and return characteristics of this market segment.
The S&P 500 Pure Value index is a style-concentrated index designed to track the performance of stocks that exhibit the strongest value characteristics by using a style-attractiveness-weighting scheme. An investor cannot directly invest in an index. The volatility of the benchmark may be materially different from the individual performance obtained by a specific investor.