Monthly Archives

June 2025

Annuities Don’t Have to be Confusing

By Annuities, Retirement Planning

Annuities Don’t Have to be Confusing


In the past, annuities have been a topic avoided by many, but lately interest levels have risen—a lot. In fact, online searches for terms like “annuities” and “pensions” are up by 160% while “are annuities good or bad” are up by 200%, according to ThinkAdvisor.

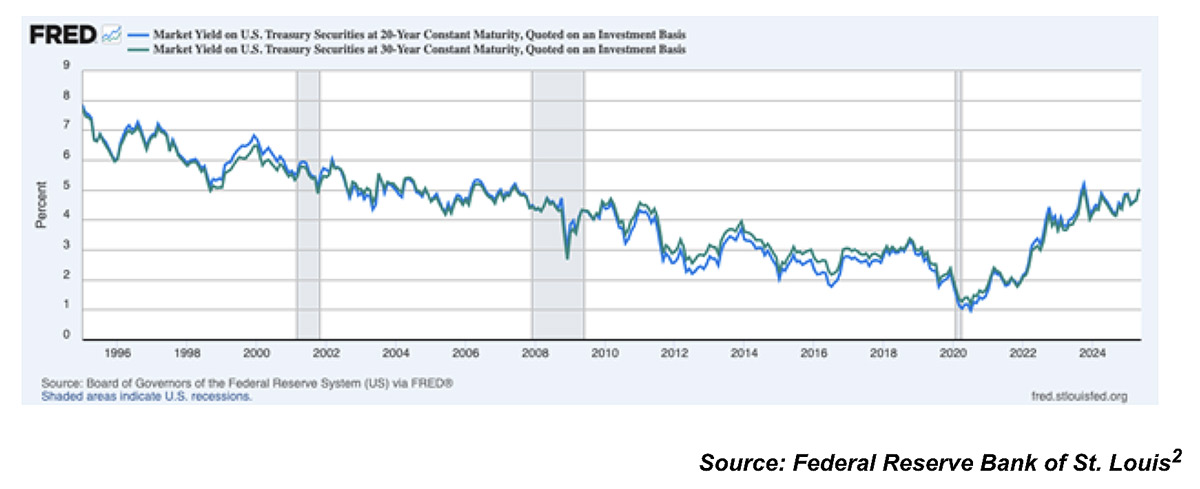
With retirement lasting longer and retirees worried about recent market volatility, tariff uncertainty, potential Social Security cuts, and continued inflation, now may be a good time to learn more about annuities and the role they can play in the retirement portfolio. And since June is Annuity Awareness Month, we decided to open up the conversation and provide some clarity.

To start, whether you’re planning for retirement, getting close, or already in it, it’s important to have a retirement plan in place, and review it regularly. Having an account like a 401(k) doesn’t mean you have a retirement plan. Too often, people put away money in a tax-deferred 401(k) or similar plan and don’t think about how they will create a stream of income from it once they are no longer getting a paycheck.

As you get closer to retirement, it’s important to reconsider how much of your savings are exposed to the ups and downs of a volatile stock market. This is especially true because of “sequence of returns risk.” Breaking this risk down, if you retire during a stock market downturn and begin withdrawing money from your 401(k) for income, your savings can shrink much faster over time compared to someone who retires and withdraws income when the market is doing well. And since no one can actually predict the future, it’s best to leverage several strategies in your retirement plan.

An annuity is a contract between an individual and an insurance company designed to provide a monthly stipend or income during retirement. There are many different types of annuities, and some have different fee structures and contract terms which may, or may not, be better in your case. That’s why it is best to work with an independent financial advisor who has access to many different types of annuities from multiple highly-rated insurance companies to compare between.

Some annuities, like lifetime fixed indexed annuities, even provide retirement income that won’t run out no matter how long you live, guaranteed by the financial strength and claims-paying ability of your insurance company providing the annuity policy. And some even have contract provisions to address inflation.

Annuities can be appealing because they allow you to take part of your retirement nest egg and purchase monthly retirement income in the form of an annuity, so you don’t have to worry about managing withdrawals aside from required minimum distributions (RMDs).

With your income accounted for, the rest of your portfolio can be accessed or left in the market, depending on future need and economic conditions.

A recent study by David Blanchett and Michael Finke found that many retirees prefer the security of guaranteed lifetime income rather than dipping into their savings or 401(k), even when they could afford to. It can be hard to think of your savings as a source of retirement income, which is why working with a retirement advisor to create a real retirement plan can help give you confidence in your financial future.

Every day, about 10,000 people turn 65 in America, and annuities may be indicated for a portion of the fixed part of their portfolios depending on their situation. Times have changed, and it’s no longer just about the ratio of stocks to bonds. Research done by academic heavyweights in economics and finance in the last 10 years indicates that annuities can help. Roger Ibbotson, Robert Shiller, and Wade D. Pfau have shown that fixed indexed annuities, when used correctly, can improve retirement outcomes compared to using bonds, with annuities helping to address longevity and market risk in the fixed portion of the typical retirement portfolio.

In today’s interest rate environment, some fixed indexed annuities even offer bonuses that can help boost your annuity’s value. Additional features such as optional coverage for long-term care, terminal illness, or spousal income can also be included, making annuities customizable.

With so many choices, it’s important to remember that every person’s situation is unique, meaning annuities may or may not be indicated depending on your specific needs and goals. That’s why we’re here to help you explore your options, explain how different annuities work, and create a long-term retirement plan. If you’d like to discuss how annuities might fit into your retirement strategy, give us a call! You can reach Bay Trust Financial in Tampa at 813.820.0069.


Sources:

https://www.thinkadvisor.com/2025/04/15/6-reasons-annuity-is-no-longer-a-dirty-word/

https://www.thinkadvisor.com/2025/04/23/for-most-americans-going-broke-in-retirement-is-a-bigger-fear-than-death-survey/

https://www.thinkadvisor.com/2025/04/15/7-things-retirement-savers-are-asking-google-about-annuities-now/

https://401kspecialistmag.com/retirees-prefer-spending-lifetime-income-over-savings/

https://www.kiplinger.com/retirement/annuities-what-you-dont-know-can-hurt-you

https://www.limra.com/en/newsroom/news-releases/2025/limra-2024-retail-annuity-sales-power-to-a-record-%24432.4-billion/

https://www.protectedincome.org/wp-content/uploads/2023/06/RP-20_Pfau_final.pdf

https://thequantum.com/a-closer-look-at-bonds-versus-fixed-indexed-annuities/

https://markets.businessinsider.com/news/stocks/insurmark-announces-barclays-bank-and-yale-economist-robert-shiller-research-showing-fixed-indexed-annuity-with-cape-index-would-have-outperformed-bonds-1028505495

https://safemoney.com/blog/annuity/shaquille-oneals-strategy-why-annuities-are-essential/


These are the views of the author, not the named representative or Advisory Services Network, LLC, and should not be construed as investment advice. Neither the named representative nor Advisory Services Network, LLC gives tax or legal advice. All information is believed to be from reliable sources; however, we make no representation as to its completeness or accuracy. Please consult your financial advisor for further information. Annuity guarantees rely on financial strength and claims-paying ability of issuing insurance company. Annuities are insurance products that may be subject to fees, surrender charges and holding periods which vary by carrier. Annuities are not FDIC insured.


Mitch Zacks – Weekly Market Commentary: Economy Keeps Chugging Along Despite Negative Headlines

By Weekly Market Commentary

As Headlines Remain Negative, the U.S. Economy Chugs Along

In recent weeks, I have written extensively about tariff-induced economic uncertainty. Many analysts continue to call for a recession, and this past week the World Bank projected the U.S. economy would grow just 1.4% in 2025—down from 2.8% last year. To be fair, I think concerns about rising input costs, inflation, business investment, and consumer spending are all valid and should be monitored closely in the coming months.1

But as I write, the reality on the ground looks quite different from the gloomy outlook that tends to play out in financial media. The U.S. economy has largely been resilient, with worst-case scenarios on tariffs avoided while economic fundamentals remain stable and strong. This combination has been driving the market rally, in my view.2

An overview of recent economic data underscores my point. According to the Bureau of Labor Statistics, the U.S. economy added 139,000 jobs in May, firmly in positive territory. The unemployment rate remained unchanged at 4.2%, where it has hovered in a narrow range for over a year. This may seem unremarkable, but that’s also the point. The labor market isn’t booming or breaking—it’s steadily supporting growth.

Private Payrolls Have Grown at a Steady Pace in Recent Months

Importantly, private sector hiring continues to outpace job losses at the federal level, where government employment declined by 22,000. Wages also climbed in May, with average hourly earnings rising 0.4% month-over-month and 3.9% year-over-year. That’s comfortably above the current pace of inflation, helping to support real household income and consumer spending. It’s a key piece of data for markets, especially given concerns that rising prices would continue eroding purchasing power.

On the inflation front, recent data continues to suggest that the worst of the inflation shock is behind us. The Federal Reserve’s preferred measure, the PCE price index, rose just 2.1% year-over-year in April, putting it a mere tenth of a percentage point above the Fed’s long-run average inflation target. Some would argue that this opens the door for the Fed to resume rate cuts, which would serve as a tailwind for markets. I’m not in that camp. In my view, stocks don’t need rate cuts to do well.

I do not want to imply that the U.S. economy is firing on all cylinders, however. Retail sales, for example, were up 4.75% from a year ago but fell month-over-month in May. Consumer demand has clearly cooled from the post-pandemic surge, and forward momentum has become more uneven. Activity in the services sector, which drives most U.S. economic output, softened in May as the ISM Services PMI fell to 49.9, its first contraction in nearly a year. New orders fell, inventories declined, and pricing pressures appeared to pick up again, a combination that suggests businesses are feeling the weight of tariff uncertainty and are growing more cautious with forward planning.

The manufacturing sector also contracted for a third straight month in May, with the Manufacturing PMI registering 48.5. While some components like new orders and production showed slight improvement, others—such as inventories, exports, and employment—remained under pressure. These readings aren’t a signal of imminent collapse, but they do reinforce that certain areas of the economy are still contending with lag effects from prior shocks, policy uncertainty, and structural adjustments.

The bottom line, we are not seeing a uniform expansion across the economy, and that’s ok. It’s important for investors not to confuse economic resilience with gangbusters growth. The latter is not needed to power stocks higher.

Bottom Line for Investors

This kind of economic resilience doesn’t mean risk is lower today than it was before “Liberation Day.” As uncertainty over trade deals and future tariff actions remains high, I do not expect businesses and consumers to invest and spend confidently. The net effect could be a short or medium-term drag on growth.

At the same time, however, investors waiting for a clear, euphoric “all clear” may find themselves missing the recovery as it quietly continues. If you find yourself waiting for the next tariff plunder, inflation shock, or retracement of the stock market’s recent rally, it may be time to move on. Markets and the economy already have.

J.P. Morgan. June 9, 2025. https://advisor.zacksim.com/e/376582/c-outlook-jobs-report-may-2025/5t5cv8/1247316295/h/owGnC7fvD72gai2Bp4elWIlr-gFT_8pC8PvEKtYttho

Wall Street Journal. May 2, 2025.

Fred Economic Data. June 9, 2025. https://advisor.zacksim.com/e/376582/series-ADPWNUSNERSA-/5t5cvc/1247316295/h/owGnC7fvD72gai2Bp4elWIlr-gFT_8pC8PvEKtYttho

DISCLOSURE

Past performance is no guarantee of future results. Inherent in any investment is the potential for loss.

Zacks Investment Management, Inc. is a wholly-owned subsidiary of Zacks Investment Research. Zacks Investment Management is an independent Registered Investment Advisory firm and acts as an investment manager for individuals and institutions. Zacks Investment Research is a provider of earnings data and other financial data to institutions and to individuals.

This material is being provided for informational purposes only and nothing herein constitutes investment, legal, accounting or tax advice, or a recommendation to buy, sell or hold a security. Do not act or rely upon the information and advice given in this publication without seeking the services of competent and professional legal, tax, or accounting counsel. Publication and distribution of this article is not intended to create, and the information contained herein does not constitute, an attorney-client relationship. No recommendation or advice is being given as to whether any investment or strategy is suitable for a particular investor. It should not be assumed that any investments in securities, companies, sectors or markets identified and described were or will be profitable. All information is current as of the date of herein and is subject to change without notice. Any views or opinions expressed may not reflect those of the firm as a whole.

Any projections, targets, or estimates in this report are forward looking statements and are based on the firm’s research, analysis, and assumptions. Due to rapidly changing market conditions and the complexity of investment decisions, supplemental information and other sources may be required to make informed investment decisions based on your individual investment objectives and suitability specifications. All expressions of opinions are subject to change without notice. Clients should seek financial advice regarding the appropriateness of investing in any security or investment strategy discussed in this presentation.

Certain economic and market information contained herein has been obtained from published sources prepared by other parties. Zacks Investment Management does not assume any responsibility for the accuracy or completeness of such information. Further, no third party has assumed responsibility for independently verifying the information contained herein and accordingly no such persons make any representations with respect to the accuracy, completeness or reasonableness of the information provided herein. Unless otherwise indicated, market analysis and conclusions are based upon opinions or assumptions that Zacks Investment Management considers to be reasonable. Any investment inherently involves a high degree of risk, beyond any specific risks discussed herein.

The S&P 500 Index is a well-known, unmanaged index of the prices of 500 large-company common stocks, mainly blue-chip stocks, selected by Standard & Poor’s. The S&P 500 Index assumes reinvestment of dividends but does not reflect advisory fees. The volatility of the benchmark may be materially different from the individual performance obtained by a specific investor. An investor cannot invest directly in an index.

The Russell 1000 Growth Index is a well-known, unmanaged index of the prices of 1000 large-company growth common stocks selected by Russell. The Russell 1000 Growth Index assumes reinvestment of dividends but does not reflect advisory fees. An investor cannot invest directly in an index. The volatility of the benchmark may be materially different from the individual performance obtained by a specific investor.

Nasdaq Composite Index is the market capitalization-weighted index of over 3,300 common equities listed on the Nasdaq stock exchange. The types of securities in the index include American depositary receipts, common stocks, real estate investment trusts (REITs) and tracking stocks, as well as limited partnership interests. The index includes all Nasdaq-listed stocks that are not derivatives, preferred shares, funds, exchange-traded funds (ETFs) or debenture securities. An investor cannot invest directly in an index. The volatility of the benchmark may be materially different from the individual performance obtained by a specific investor.

The Dow Jones Industrial Average measures the daily stock market movements of 30 U.S. publicly-traded companies listed on the NASDAQ or the New York Stock Exchange (NYSE). The 30 publicly-owned companies are considered leaders in the United States economy. An investor cannot directly invest in an index. The volatility of the benchmark may be materially different from the individual performance obtained by a specific investor.

The Bloomberg Global Aggregate Index is a flagship measure of global investment grade debt from twenty-four local currency markets. This multi-currency benchmark includes treasury, government-related, corporate and securitized fixed-rate bonds from both developed and emerging markets issuers. An investor cannot invest directly in an index. The volatility of the benchmark may be materially different from the individual performance obtained by a specific investor.

The ICE Exchange-Listed Fixed & Adjustable Rate Preferred Securities Index is a modified market capitalization weighted index composed of preferred stock and securities that are functionally equivalent to preferred stock including, but not limited to, depositary preferred securities, perpetual subordinated debt and certain securities issued by banks and other financial institutions that are eligible for capital treatment with respect to such instruments akin to that received for issuance of straight preferred stock. An investor cannot invest directly in an index. The volatility of the benchmark may be materially different from the individual performance obtained by a specific investor.

The MSCI ACWI ex U.S. Index captures large and mid-cap representation across 22 of 23 Developed Markets (DM) countries (excluding the United States) and 24 Emerging Markets (EM) countries. The index covers approximately 85% of the global equity opportunity set outside the U.S. An investor cannot invest directly in an index. The volatility of the benchmark may be materially different from the individual performance obtained by a specific investor.

The Russell 2000 Index is a well-known, unmanaged index of the prices of 2000 small-cap company common stocks, selected by Russell. The Russell 2000 Index assumes reinvestment of dividends but does not reflect advisory fees. An investor cannot invest directly in an index. The volatility of the benchmark may be materially different from the individual performance obtained by a specific investor.

The S&P Mid Cap 400 provides investors with a benchmark for mid-sized companies. The index, which is distinct from the large-cap S&P 500, is designed to measure the performance of 400 mid-sized companies, reflecting the distinctive risk and return characteristics of this market segment.

The S&P 500 Pure Value index is a style-concentrated index designed to track the performance of stocks that exhibit the strongest value characteristics by using a style-attractiveness-weighting scheme. An investor cannot directly invest in an index. The volatility of the benchmark may be materially different from the individual performance obtained by a specific investor.

Mitch Zacks – Weekly Market Commentary: As Baby Boomers Age, Will the Shift to Bonds Impact the Stock Market?

By Weekly Market Commentary

As Baby Boomers Age, Will the Shift to Bonds Impact the Stock Market?

It’s been dubbed the “Great Boomer Selloff.”

If you have not heard this term in financial publications yet, it may just be a matter of time before you encounter it. The basic idea goes something like this: baby boomers, who collectively own trillions in financial assets, are entering retirement at a rapid pace. The implication is that in retirement, this entire generation will systematically shift their portfolios away from stocks and into income-oriented strategies, like bonds. With Gen X being a smaller generation, and Millennials and Gen Z still ramping up their savings, the fear is that selling will outpace buying, causing stock prices to suffer for years.1

Recent media coverage gives the “Great Boomer Selloff” an air of urgency. But like many forecasts connecting demographics with stock market performance, it glosses over several important realities.

The most important reality, in my view, is the surprise factor (or lack thereof). The baby boomer generation did not just start aging and retiring in large numbers last month—these shifts have been unfolding for decades. What tends to move markets are unexpected developments that add or subtract trillions from global GDP—not slow-moving, well-known changes like we’re seeing with demographics.

The other problem with the “Great Boomer Selloff” theory is that it makes incorrect assumptions about retail investor behavior, while also overstating the impact that a generation of retail investors can have on the stock market.

Let’s start with the former. The baby boomer generation spans nearly two decades, from ages 61 to 79. Will all boomers start selling stocks en masse at the same time? I highly doubt it. If there’s a net drawdown, it will likely unfold over time—not in a single, market-shaking event. Many boomers will continue to buy and hold stocks for years to come, whether it’s to generate the growth needed to span longer retirements, to continue building wealth for legacy purposes, or to generate income via dividends. In other words, it is far from assured that boomers will abandon equities as they age.

On the latter point of overstating retail investor impact, it’s important to remember that retail trading is only one part of the demand equation. Institutional investors like pension funds, endowments, sovereign wealth funds, and insurance companies are massive market participants with long investment horizons. Institutions don’t invest for 10 or even 20-year time horizons, they’re thinking much longer term. Many are also required to maintain equity exposure to meet future obligations. And this does not even factor-in the consistent demand from corporate share buybacks.

On the supply side, equity markets look different than they did when boomers were accumulating assets in the 1980s and 1990s. The number of publicly traded U.S. companies has declined significantly from more than 7,000 in the late 1990s to around 3,700 today. That’s due to several forces: fewer IPOs, a preference for staying private, a surge in mergers and acquisitions, and sustained corporate buyback programs. In short, the supply of investable equities has been shrinking. Even if demand from one generation softens slightly, there are fewer shares available to push prices lower.

Lastly, Millennials and Gen Z are increasingly participating in equity market investing. They’re investing through workplace retirement plans, brokerage platforms, and digital tools that make market access easier than ever. They may not be able to fully replace boomer demand overnight—but they don’t have to. Their growing participation is part of a longer-term transition that should help support demand over time.

Bottom Line for Investors

Demographics are important, but they’re not a massive surprise force moving the stock market. The “Great Boomer Selloff” suggests that a generation of investors is poised to shock the markets with asset allocation adjustments in their retirement years, but the theory omits the reality that markets are shaped by a wide range of forces: supply and demand, institutional behavior, investor psychology, and more.

I’ve also seen this worry play out before. The theory that shifting demographics would adversely impact the stock market has been circulating for decades, and yet the stock market trades today near all-time highs with new generations of investors participating. I don’t expect that to change as baby boomers get older.

Reuters. May 23, 2025. https://advisor.zacksim.com/e/376582/verwhelm-us-stocks-2025-05-23-/5t3z4m/1242320052/h/vAqtUW7H53T-HJvYhYwGMtUdOIxwhsnVolBnWOi_Qp0

DISCLOSURE
Past performance is no guarantee of future results. Inherent in any investment is the potential for loss.

Zacks Investment Management, Inc. is a wholly-owned subsidiary of Zacks Investment Research. Zacks Investment Management is an independent Registered Investment Advisory firm and acts as an investment manager for individuals and institutions. Zacks Investment Research is a provider of earnings data and other financial data to institutions and to individuals.

This material is being provided for informational purposes only and nothing herein constitutes investment, legal, accounting or tax advice, or a recommendation to buy, sell or hold a security. Do not act or rely upon the information and advice given in this publication without seeking the services of competent and professional legal, tax, or accounting counsel. Publication and distribution of this article is not intended to create, and the information contained herein does not constitute, an attorney-client relationship. No recommendation or advice is being given as to whether any investment or strategy is suitable for a particular investor. It should not be assumed that any investments in securities, companies, sectors or markets identified and described were or will be profitable. All information is current as of the date of herein and is subject to change without notice. Any views or opinions expressed may not reflect those of the firm as a whole.

Any projections, targets, or estimates in this report are forward looking statements and are based on the firm’s research, analysis, and assumptions. Due to rapidly changing market conditions and the complexity of investment decisions, supplemental information and other sources may be required to make informed investment decisions based on your individual investment objectives and suitability specifications. All expressions of opinions are subject to change without notice. Clients should seek financial advice regarding the appropriateness of investing in any security or investment strategy discussed in this presentation.

Certain economic and market information contained herein has been obtained from published sources prepared by other parties.  Zacks Investment Management does not assume any responsibility for the accuracy or completeness of such information. Further, no third party has assumed responsibility for independently verifying the information contained herein and accordingly no such persons make any representations with respect to the accuracy, completeness or reasonableness of the information provided herein. Unless otherwise indicated, market analysis and conclusions are based upon opinions or assumptions that Zacks Investment Management considers to be reasonable. Any investment inherently involves a high degree of risk, beyond any specific risks discussed herein.

The S&P 500 Index is a well-known, unmanaged index of the prices of 500 large-company common stocks, mainly blue-chip stocks, selected by Standard & Poor’s. The S&P 500 Index assumes reinvestment of dividends but does not reflect advisory fees. The volatility of the benchmark may be materially different from the individual performance obtained by a specific investor. An investor cannot invest directly in an index.

The Russell 1000 Growth Index is a well-known, unmanaged index of the prices of 1000 large-company growth common stocks selected by Russell. The Russell 1000 Growth Index assumes reinvestment of dividends but does not reflect advisory fees. An investor cannot invest directly in an index. The volatility of the benchmark may be materially different from the individual performance obtained by a specific investor.

Nasdaq Composite Index is the market capitalization-weighted index of over 3,300 common equities listed on the Nasdaq stock exchange. The types of securities in the index include American depositary receipts, common stocks, real estate investment trusts (REITs) and tracking stocks, as well as limited partnership interests. The index includes all Nasdaq-listed stocks that are not derivatives, preferred shares, funds, exchange-traded funds (ETFs) or debenture securities. An investor cannot invest directly in an index. The volatility of the benchmark may be materially different from the individual performance obtained by a specific investor.

The Dow Jones Industrial Average measures the daily stock market movements of 30 U.S. publicly-traded companies listed on the NASDAQ or the New York Stock Exchange (NYSE). The 30 publicly-owned companies are considered leaders in the United States economy. An investor cannot directly invest in an index.  The volatility of the benchmark may be materially different from the individual performance obtained by a specific investor.

The Bloomberg Global Aggregate Index is a flagship measure of global investment grade debt from twenty-four local currency markets. This multi-currency benchmark includes treasury, government-related, corporate and securitized fixed-rate bonds from both developed and emerging markets issuers. An investor cannot invest directly in an index. The volatility of the benchmark may be materially different from the individual performance obtained by a specific investor.

The ICE Exchange-Listed Fixed & Adjustable Rate Preferred Securities Index is a modified market capitalization weighted index composed of preferred stock and securities that are functionally equivalent to preferred stock including, but not limited to, depositary preferred securities, perpetual subordinated debt and certain securities issued by banks and other financial institutions that are eligible for capital treatment with respect to such instruments akin to that received for issuance of straight preferred stock. An investor cannot invest directly in an index. The volatility of the benchmark may be materially different from the individual performance obtained by a specific investor.

The MSCI ACWI ex U.S. Index captures large and mid-cap representation across 22 of 23 Developed Markets (DM) countries (excluding the United States) and 24 Emerging Markets (EM) countries. The index covers approximately 85% of the global equity opportunity set outside the U.S. An investor cannot invest directly in an index. The volatility of the benchmark may be materially different from the individual performance obtained by a specific investor.

The Russell 2000 Index is a well-known, unmanaged index of the prices of 2000 small-cap company common stocks, selected by Russell. The Russell 2000 Index assumes reinvestment of dividends but does not reflect advisory fees. An investor cannot invest directly in an index. The volatility of the benchmark may be materially different from the individual performance obtained by a specific investor.

The S&P Mid Cap 400 provides investors with a benchmark for mid-sized companies. The index, which is distinct from the large-cap S&P 500, is designed to measure the performance of 400 mid-sized companies, reflecting the distinctive risk and return characteristics of this market segment.

The S&P 500 Pure Value index is a style-concentrated index designed to track the performance of stocks that exhibit the strongest value characteristics by using a style-attractiveness-weighting scheme. An investor cannot directly invest in an index.  The volatility of the benchmark may be materially different from the individual performance obtained by a specific investor.

Mitch Zacks – Weekly Market Commentary: Bond Markets Signal Trouble Ahead. Should Investors be Worried?

By Weekly Market Commentary

Bond Markets are Jittery – Should Investors Be Too?

Auctions for 20-year U.S. Treasuries are generally a routine, straightforward event that few investors pay much attention to.

That was not the case last week.

The auction for roughly $16 billion in 20-year debt featured unusually soft demand, with investors bidding up yields past 5%, well above the approximately 4.6% average seen in recent auctions. The 20-year bond joined 30-year Treasury yields above 5%, and the 10-year also continued to inch higher, crossing 4.6%. Stocks sold off sharply on the news.1

20-year and 30-Year U.S. Treasury Bond Yields Have Been Climbing Steadily

To be fair, these are not financial crisis-type moves in the bond markets, and there have been plenty of periods historically when yields are higher than they are now and the economy and stock market performed well. But it is correct to point out, in my view, that markets appear to be growing somewhat uncomfortable with the U.S.’s inflation and fiscal outlook.

In a past Mitch on the Markets column, I laid out three reasons why Treasury bond yields may move significantly higher:

  • 1.  Expectations for economic growth are going up, tied to expectations for pro-growth, pro-cyclical policies from the [current] administration.
  • 2.  Inflation expectations are going up, due to strong expected growth in an economy near full capacity or because of other factors, like trade policy (tariffs).
  • 3.  The bond market becomes increasingly concerned about fiscal health/sustainability, with growing deficits necessitating higher levels of bond issuance.

The concern is that yields are currently rising because of some combination of #2 and #3. The possibility of higher tariffs and higher government deficits (tied to the budget bill) aren’t helping.

Let’s start with the deficit issue. The starting point for the U.S. in 2025 is not great—the debt-to-GDP ratio is approaching a new all-time high, and the deficit relative to GDP is about 5% wider than it has historically been when the economy was at full employment. It is with this backdrop that “One, Big, Beautiful Bill” has passed the House of Representatives, which introduces tax cut extensions, new tax cuts, and spending provisions that are not fully paid for by cuts or new revenue. The implication is more annual budget deficits and additions to the national debt, which means more Treasury issuance. Yields are not likely to move lower in this scenario.

On the spending side, “One, Big, Beautiful Bill” introduces some spending cuts and measures like work requirements for Medicaid coverage, and the Department of Government Efficiency (DOGE) continues efforts to reduce government spending. But the scope of these spending cuts together is not likely to cover the cost of the tax cuts and annual government expenditures, which means shrinking the deficit is not likely. The Senate may demand more spending cuts in the bill, but the actual outcome remains to be seen. It’s understandable that bond markets are a bit wobbly in the meantime.

On the inflation side of the ledger, it is really all about whether tariffs remain in force, and for how long. In Trump’s first term, tariff threats were loud on the ‘bark’ but ultimately far more modest on the ‘bite.’  The tariffs that stuck were largely relegated to China, and corporations responded in many cases by rerouting trade through Vietnam and other intermediaries (including Mexico). U.S. markets and the economy did not feel much pain, and overall core inflation remained below 2% throughout this period.

We do not know where tariffs will end up for the wide variety of U.S. trading partners. But the baseline 10% universal tariff will arguably raise inflation at least moderately, perhaps to around 3% at the peak. Growth could also see an impact, given higher import costs and greater uncertainty. If Treasury yields go up in this case because of higher inflation and inflation expectations—without a corresponding acceleration in growth—that could trigger another correction in stocks, in my view.

Bottom Line for Investors

There’s still time. Tariffs, growing budget deficits, and sluggish economic growth are not foregone conclusions, and sharply rising bond yields aren’t either. We could see a breakthrough in trade deals, changes could be made to One, Big, Beautiful Bill to make it more budget neutral, and inflation could remain in check as the economy remains fundamentally strong. U.S. Treasury bond yields could remain in a trading range under these circumstances, and the Fed may even find cause to lower the fed funds rate and steepen the yield curve in the process.

In 2023, acute worries over too much debt and deficit spending faded as inflation came down and the economy grew, fueling the bull market in stocks and pulling in foreign investment. The door is open for this possibility in 2025, too.

Wall Street Journal. May 22, 2025. https://advisor.zacksim.com/e/376582/al-mess-in-washington-fcebd153/5t2vxb/1237912929/h/zpGCdFbX-oF19sjx8ZsTe4zrMB4i4WyP0yMDfChzOVI

Fred Economic Data. May 21, 2025. https://advisor.zacksim.com/e/376582/series-DGS20-/5t2vxf/1237912929/h/zpGCdFbX-oF19sjx8ZsTe4zrMB4i4WyP0yMDfChzOVI

DISCLOSURE
Past performance is no guarantee of future results. Inherent in any investment is the potential for loss.

Zacks Investment Management, Inc. is a wholly-owned subsidiary of Zacks Investment Research. Zacks Investment Management is an independent Registered Investment Advisory firm and acts as an investment manager for individuals and institutions. Zacks Investment Research is a provider of earnings data and other financial data to institutions and to individuals.

This material is being provided for informational purposes only and nothing herein constitutes investment, legal, accounting or tax advice, or a recommendation to buy, sell or hold a security. Do not act or rely upon the information and advice given in this publication without seeking the services of competent and professional legal, tax, or accounting counsel. Publication and distribution of this article is not intended to create, and the information contained herein does not constitute, an attorney-client relationship. No recommendation or advice is being given as to whether any investment or strategy is suitable for a particular investor. It should not be assumed that any investments in securities, companies, sectors or markets identified and described were or will be profitable. All information is current as of the date of herein and is subject to change without notice. Any views or opinions expressed may not reflect those of the firm as a whole.

Any projections, targets, or estimates in this report are forward looking statements and are based on the firm’s research, analysis, and assumptions. Due to rapidly changing market conditions and the complexity of investment decisions, supplemental information and other sources may be required to make informed investment decisions based on your individual investment objectives and suitability specifications. All expressions of opinions are subject to change without notice. Clients should seek financial advice regarding the appropriateness of investing in any security or investment strategy discussed in this presentation.

Certain economic and market information contained herein has been obtained from published sources prepared by other parties.  Zacks Investment Management does not assume any responsibility for the accuracy or completeness of such information. Further, no third party has assumed responsibility for independently verifying the information contained herein and accordingly no such persons make any representations with respect to the accuracy, completeness or reasonableness of the information provided herein. Unless otherwise indicated, market analysis and conclusions are based upon opinions or assumptions that Zacks Investment Management considers to be reasonable. Any investment inherently involves a high degree of risk, beyond any specific risks discussed herein.

The S&P 500 Index is a well-known, unmanaged index of the prices of 500 large-company common stocks, mainly blue-chip stocks, selected by Standard & Poor’s. The S&P 500 Index assumes reinvestment of dividends but does not reflect advisory fees. The volatility of the benchmark may be materially different from the individual performance obtained by a specific investor. An investor cannot invest directly in an index.

The Russell 1000 Growth Index is a well-known, unmanaged index of the prices of 1000 large-company growth common stocks selected by Russell. The Russell 1000 Growth Index assumes reinvestment of dividends but does not reflect advisory fees. An investor cannot invest directly in an index. The volatility of the benchmark may be materially different from the individual performance obtained by a specific investor.

Nasdaq Composite Index is the market capitalization-weighted index of over 3,300 common equities listed on the Nasdaq stock exchange. The types of securities in the index include American depositary receipts, common stocks, real estate investment trusts (REITs) and tracking stocks, as well as limited partnership interests. The index includes all Nasdaq-listed stocks that are not derivatives, preferred shares, funds, exchange-traded funds (ETFs) or debenture securities. An investor cannot invest directly in an index. The volatility of the benchmark may be materially different from the individual performance obtained by a specific investor.

The Dow Jones Industrial Average measures the daily stock market movements of 30 U.S. publicly-traded companies listed on the NASDAQ or the New York Stock Exchange (NYSE). The 30 publicly-owned companies are considered leaders in the United States economy. An investor cannot directly invest in an index.  The volatility of the benchmark may be materially different from the individual performance obtained by a specific investor.

The Bloomberg Global Aggregate Index is a flagship measure of global investment grade debt from twenty-four local currency markets. This multi-currency benchmark includes treasury, government-related, corporate and securitized fixed-rate bonds from both developed and emerging markets issuers. An investor cannot invest directly in an index. The volatility of the benchmark may be materially different from the individual performance obtained by a specific investor.

The ICE Exchange-Listed Fixed & Adjustable Rate Preferred Securities Index is a modified market capitalization weighted index composed of preferred stock and securities that are functionally equivalent to preferred stock including, but not limited to, depositary preferred securities, perpetual subordinated debt and certain securities issued by banks and other financial institutions that are eligible for capital treatment with respect to such instruments akin to that received for issuance of straight preferred stock. An investor cannot invest directly in an index. The volatility of the benchmark may be materially different from the individual performance obtained by a specific investor.

The MSCI ACWI ex U.S. Index captures large and mid-cap representation across 22 of 23 Developed Markets (DM) countries (excluding the United States) and 24 Emerging Markets (EM) countries. The index covers approximately 85% of the global equity opportunity set outside the U.S. An investor cannot invest directly in an index. The volatility of the benchmark may be materially different from the individual performance obtained by a specific investor.

The Russell 2000 Index is a well-known, unmanaged index of the prices of 2000 small-cap company common stocks, selected by Russell. The Russell 2000 Index assumes reinvestment of dividends but does not reflect advisory fees. An investor cannot invest directly in an index. The volatility of the benchmark may be materially different from the individual performance obtained by a specific investor.

The S&P Mid Cap 400 provides investors with a benchmark for mid-sized companies. The index, which is distinct from the large-cap S&P 500, is designed to measure the performance of 400 mid-sized companies, reflecting the distinctive risk and return characteristics of this market segment.

The S&P 500 Pure Value index is a style-concentrated index designed to track the performance of stocks that exhibit the strongest value characteristics by using a style-attractiveness-weighting scheme. An investor cannot directly invest in an index.  The volatility of the benchmark may be materially different from the individual performance obtained by a specific investor.