Monthly Archives

August 2025

Mitch Zacks – Weekly Market Commentary: Is There a Disconnect Forming Between the Equity Market and the Economy?

By Weekly Market Commentary

The U.S. stock market continues to hover around all-time highs, and with it, in my view, investor optimism has been on the rise. As I alluded to in last week’s column, it seems that many investors are comfortable assuming the worst of the trade war, tariff hikes, and policy uncertainty is behind us.

This may be true. But to arrive at this conclusion, it is also necessary to look past some recent weakness in economic data, where the picture suggests that growth is more middling than booming. For long-term investors, this does not necessarily signal trouble ahead. But it does argue for caution, particularly if enthusiasm is starting to shift toward complacency, as I wrote last week.1

Let’s look at what the data is telling us.

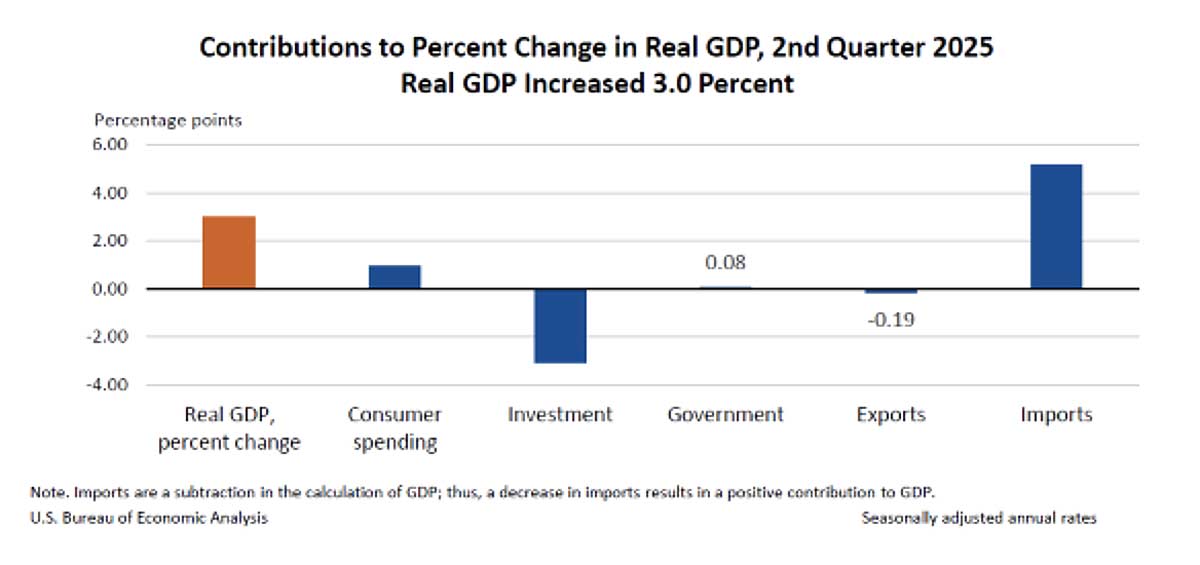
On the surface, the U.S.’s Q2 GDP print (3.0% annualized) looked very solid. But digging into the details reveals a more mixed picture. In Q1, GDP contracted by -0.5% because imports surged nearly 38% annualized as businesses and consumers rushed to ‘front run’ new tariffs. Since imports subtract from GDP, there’s a fair argument that the economy looked weaker in the first three months than it really was.

But in Q2, that dynamic flipped.

Imports plunged more than -30% annualized, creating a statistical boost to growth. Exports fell as well, down -1.8%, as the rest of the world worked through the goods they had stockpiled earlier in the year. In my view, this indication of declining total trade is what stood out, indicating weakening overall demand in the global economy. It’s one data point, but it will be key to watch these figures for the rest of the year.

When you strip away the trade swings and look at private domestic demand, which again is a more telling signal of economic strength, in my view, the story is less rosy. Consumer spending grew at a 1.4% annualized pace, which was better than Q1 but still pretty moderate. Business investment, which is more cyclical and a key swing factor, slowed sharply from 10.3% in Q1 to just 1.9% in Q2. Investment in structures fell by double-digits, and R&D posted its third straight decline. These are signs businesses are pressing pause on long-term projects until there is more clarity on tariffs and trade policy, and to me, it’s an overlooked negative that prompts me to think more cautiously.
The jobs picture is also looking more complicated than it did a few months ago. July’s payroll growth came in at just 73,000, and prior months’ gains were revised down by a combined 258,000. The Conference Board’s Employment Trends Index fell to 107.6 in July, its lowest reading since last fall. These figures suggest hiring momentum is cooling.

Finally, tariff-related pressures are increasingly evident in inflation data. The core Consumer Price Index rose 3.1% year-over-year in July, up from 2.8% in May. Producer prices surged 0.9% month-over-month, marking the biggest jump in three years. Producer prices have historically led consumer inflation data, so we could see some of this pressure in the CPI data this fall. To be fair, the inflation pass-through looks more gradual than disruptive, but it’s also early. Question marks over inflation can complicate the policy outlook, which can make markets vulnerable to a negative surprise. Remember, at this point, markets continue to price in multiple rate cuts later this year.

Bottom Line for Investors

I want to be clear that we still see the U.S. economy as resilient. That’s the bottom line. But we’re also taking a much closer look at the underlying data, which we think paints more of a ‘muddle-through’ environment than an all-clear expansion.

For investors, this isn’t a reason to turn bearish. But it is a reminder that when sentiment shifts toward complacency, caution is warranted. The market may paint a picture of a gangbuster’s economy, but the data suggests something more moderate. This gap is worth watching closely.

J.P. Morgan. August 15, 2025. https://advisor.zacksim.com/e/376582/-p-five-hundred-all-time-highs/5tgjff/1296872166/h/Vi704wUxa3E684HWOfTYB4ShxAFYEiJgt-KnJmeoSwQ

DISCLOSURE
Past performance is no guarantee of future results. Inherent in any investment is the potential for loss.

Zacks Investment Management, Inc. is a wholly-owned subsidiary of Zacks Investment Research. Zacks Investment Management is an independent Registered Investment Advisory firm and acts as an investment manager for individuals and institutions. Zacks Investment Research is a provider of earnings data and other financial data to institutions and to individuals.

This material is being provided for informational purposes only and nothing herein constitutes investment, legal, accounting or tax advice, or a recommendation to buy, sell or hold a security. Do not act or rely upon the information and advice given in this publication without seeking the services of competent and professional legal, tax, or accounting counsel. Publication and distribution of this article is not intended to create, and the information contained herein does not constitute, an attorney-client relationship. No recommendation or advice is being given as to whether any investment or strategy is suitable for a particular investor. It should not be assumed that any investments in securities, companies, sectors or markets identified and described were or will be profitable. All information is current as of the date of herein and is subject to change without notice. Any views or opinions expressed may not reflect those of the firm as a whole.

Any projections, targets, or estimates in this report are forward looking statements and are based on the firm’s research, analysis, and assumptions. Due to rapidly changing market conditions and the complexity of investment decisions, supplemental information and other sources may be required to make informed investment decisions based on your individual investment objectives and suitability specifications. All expressions of opinions are subject to change without notice. Clients should seek financial advice regarding the appropriateness of investing in any security or investment strategy discussed in this presentation.

Certain economic and market information contained herein has been obtained from published sources prepared by other parties.  Zacks Investment Management does not assume any responsibility for the accuracy or completeness of such information. Further, no third party has assumed responsibility for independently verifying the information contained herein and accordingly no such persons make any representations with respect to the accuracy, completeness or reasonableness of the information provided herein. Unless otherwise indicated, market analysis and conclusions are based upon opinions or assumptions that Zacks Investment Management considers to be reasonable. Any investment inherently involves a high degree of risk, beyond any specific risks discussed herein.

The S&P 500 Index is a well-known, unmanaged index of the prices of 500 large-company common stocks, mainly blue-chip stocks, selected by Standard & Poor’s. The S&P 500 Index assumes reinvestment of dividends but does not reflect advisory fees. The volatility of the benchmark may be materially different from the individual performance obtained by a specific investor. An investor cannot invest directly in an index.

The Russell 1000 Growth Index is a well-known, unmanaged index of the prices of 1000 large-company growth common stocks selected by Russell. The Russell 1000 Growth Index assumes reinvestment of dividends but does not reflect advisory fees. An investor cannot invest directly in an index. The volatility of the benchmark may be materially different from the individual performance obtained by a specific investor.

Nasdaq Composite Index is the market capitalization-weighted index of over 3,300 common equities listed on the Nasdaq stock exchange. The types of securities in the index include American depositary receipts, common stocks, real estate investment trusts (REITs) and tracking stocks, as well as limited partnership interests. The index includes all Nasdaq-listed stocks that are not derivatives, preferred shares, funds, exchange-traded funds (ETFs) or debenture securities. An investor cannot invest directly in an index. The volatility of the benchmark may be materially different from the individual performance obtained by a specific investor.
The Dow Jones Industrial Average measures the daily stock market movements of 30 U.S. publicly-traded companies listed on the NASDAQ or the New York Stock Exchange (NYSE). The 30 publicly-owned companies are considered leaders in the United States economy. An investor cannot directly invest in an index.  The volatility of the benchmark may be materially different from the individual performance obtained by a specific investor.

The Bloomberg Global Aggregate Index is a flagship measure of global investment grade debt from twenty-four local currency markets. This multi-currency benchmark includes treasury, government-related, corporate and securitized fixed-rate bonds from both developed and emerging markets issuers. An investor cannot invest directly in an index. The volatility of the benchmark may be materially different from the individual performance obtained by a specific investor.

The ICE Exchange-Listed Fixed & Adjustable Rate Preferred Securities Index is a modified market capitalization weighted index composed of preferred stock and securities that are functionally equivalent to preferred stock including, but not limited to, depositary preferred securities, perpetual subordinated debt and certain securities issued by banks and other financial institutions that are eligible for capital treatment with respect to such instruments akin to that received for issuance of straight preferred stock. An investor cannot invest directly in an index. The volatility of the benchmark may be materially different from the individual performance obtained by a specific investor.

The MSCI ACWI ex U.S. Index captures large and mid-cap representation across 22 of 23 Developed Markets (DM) countries (excluding the United States) and 24 Emerging Markets (EM) countries. The index covers approximately 85% of the global equity opportunity set outside the U.S. An investor cannot invest directly in an index. The volatility of the benchmark may be materially different from the individual performance obtained by a specific investor.

The Russell 2000 Index is a well-known, unmanaged index of the prices of 2000 small-cap company common stocks, selected by Russell. The Russell 2000 Index assumes reinvestment of dividends but does not reflect advisory fees. An investor cannot invest directly in an index. The volatility of the benchmark may be materially different from the individual performance obtained by a specific investor.

The S&P Mid Cap 400 provides investors with a benchmark for mid-sized companies. The index, which is distinct from the large-cap S&P 500, is designed to measure the performance of 400 mid-sized companies, reflecting the distinctive risk and return characteristics of this market segment.

The S&P 500 Pure Value index is a style-concentrated index designed to track the performance of stocks that exhibit the strongest value characteristics by using a style-attractiveness-weighting scheme. An investor cannot directly invest in an index.  The volatility of the benchmark may be materially different from the individual performance obtained by a specific investor.

Breaking Down the One Big Beautiful Bill Act

By Retirement Planning, Tax Planning

The “One Big Beautiful Bill Act” (OBBBA), often called the “Big Beautiful Bill,” is a sweeping piece of legislation that touches nearly every aspect of American life. Spanning over 800 pages, it introduces changes across the tax code, retirement savings, estate planning, border security, ICE, and government operations. The IRS is expected to issue further clarifications on many provisions, but what’s clear is that this bill brings a wide range of reforms that can impact nearly every household.

Here are just a few of the biggest changes as we understand them:

  1. Lower Tax Rates Made Permanent and a Higher Standard Deduction

The bill makes permanent the individual tax rate percentages first introduced by the 2017 Tax Cuts and Jobs Act (TCJA) for the tax year 2025 and beyond; thereafter income brackets will be indexed for inflation annually. The tax rates, as well as brackets for 2025, are as follows:

  • The top tax rate remains 37% for individual single taxpayers with incomes greater than $626,350 ($751,600 for married couples filing jointly).
  • 35% for incomes over $250,525 ($501,050 for married couples filing jointly).
  • 32% for incomes over $197,300 ($394,600 for married couples filing jointly).
  • 24% for incomes over $103,350 ($206,700 for married couples filing jointly).
  • 22% for incomes over $48,475 ($96,950 for married couples filing jointly).
  • 12% for incomes over $11,925 ($23,850 for married couples filing jointly).
  • 10% for incomes $11,925 or less ($23,850 or less for married couples filing jointly).

Along with this, the standard deduction has been increased slightly to $31,500 for joint filers, $23,625 for heads of household, and $15,750 for single filers for 2025—adjusted annually for inflation going forward.

  1. Temporary Deductions (For Tax Years 2025–2028 Only)
  • Up to $25,000 of tips may be deducted from federal taxable income for those who work in industries where tips are customary. The deduction amount phases out by $100 for each $1000 when adjusted gross income exceeds $150,000 for single filers and $300,000 for joint filers. While the deduction applies to “cash” tips only, the OBBBA broadly defines “cash” tips to include tips paid in cash or charged.
  • Overtime Pay Deduction: Up to $25,000 of overtime compensation for married filers and $12,500 for single filers may be deducted from federal taxable income. The deduction phases out when adjusted gross income exceeds $150,000 for single filers and $300,000 for joint filers.
  • Senior Deduction: Mistakenly referred to as a Social Security tax cut, the OBBBA established a temporary income tax deduction of $6,000 per eligible filer for people age 65 or older—provided their modified adjusted gross income does not exceed $75,000 for single filers, or $150,000 for those married filing jointly.
  • Auto Loan Interest: Auto loan interest is made income tax deductible for new autos with final assembly in the United States. The deduction is limited to $10,000 and phases out when income exceeds $100,000 for single filers and $200,000 for joint filers.

These deductions can help reduce taxable income to support some middle-income earners but will sunset after 2028 unless renewed.

  1. Child and Family Benefits
  • The child tax credit was permanently raised by another $200 to $2,200 per qualifying child for 2025. Beginning in 2026, this will be indexed for inflation. (Earned income must be at least $2,500 in order to claim any child credit.) The OBBBA also makes permanent the $500 nonrefundable credit for other dependents who do not qualify for the child tax credit, including those over the age of 16, and makes permanent a requirement that the child and at least one parent have a Social Security number.
  • New Trump Accounts: A tax-deferred savings account is meant for American children born between 2025 and 2028. There is a one-time government deposit of $1,000 and families can contribute up to $5,000 per year with investment growth tax-deferred. Employers can also contribute $2,500 to the employee’s eligible dependent child.
  1. Permanently Higher Estate and Lifetime Gift Tax Exemption Amounts

The higher federal Estate and Lifetime Gift Tax exemption amounts will no longer sunset in 2026. Instead of reverting to pre-TCJA levels, the OBBB permanently increases the exemption to $15 million per person, or $30 million for joint filers starting in 2026, with the new exemption amount indexed for inflation going forward. The Generation-Skipping Transfer (GST) exemption will match this amount. (For the 2025 tax year, the exemption amount is $13.99 million or $28.98 million per couple.)

  1. SALT Deduction Expands Until 2030 and Current Mortgage Interest Deduction Amount Made Permanent
  • The deduction cap for State and Local Taxes (SALT) has been increased to $40,000 starting in 2025 and will then climb by 1% annually through 2029 before reverting back to $10,000 in 2030 (phases out for taxpayers with an income over $500,000).
  • Qualified residence interest deduction: Originally set to increase to $1 million, the OBBBA modified the limit on the deduction for qualified residence interest to a maximum of $750,000 of home acquisition debt permanently. The disallowance of interest on home equity loans has been made permanent unless loan proceeds are used to buy, build, or substantially improve the home securing the loan.
  1. Charitable Deduction Increase for Nonitemizers

The OBBB expands the ability of nonitemizers to take a bigger charitable deduction permanently. The preexisting limit of $300 ($600 for married individuals filing jointly) is increased to $1,000 ($2,000 for joint returns). This above-the-line deduction is available only for cash gifts made to public charities.

  1. What’s Ending

While some incentives were expanded or made permanent, others are being phased out. For instance, tax credits for electric vehicles (EVs) end September 30, 2025. Other homeowner tax credits for home energy improvements, such as solar panels, doors and windows, and heat pumps, will end December 31, 2025.

While we’ve only highlighted a few key changes, this bill spans over 800 pages, making it important to stay informed and regularly review your plan. Planning ahead remains foundational, as future shifts or challenges could bring additional changes. More guidance is expected from the IRS in the months ahead, but in the meantime, contact us with any questions or concerns.  You can reach BayTrust Financial in Tampa at 813.820.0069.


This overview is compiled from information believed to be true. This article should not be relied upon for tax or financial advice. Please check with your tax and financial professionals before making any changes to your plan.

These are the views of the author, not the named Representative or Advisory Services Network, LLC, and should not be construed as investment advice. Neither the named Representative nor Advisory Services Network, LLC gives tax or legal advice. All information is believed to be from reliable sources; however, we make no representation as to its completeness or accuracy. Please consult your Financial Advisor for further information.

Sources:

https://www.whitehouse.gov/articles/2025/06/capitol-hill-touts-benefits-of-the-one-big-beautiful-bill/

https://waysandmeans.house.gov/2025/05/22/passed-the-one-big-beautiful-bill-moves-one-step-closer-to-president-trumps-desk/

https://www.forbes.com/sites/martinshenkman/2025/07/05/big-beautiful-estate-plan-impact-of-the-big-beautiful-bill-obbba/

https://www.fedsmith.com/2025/07/10/what-the-one-big-beautiful-bill-act-means-for-federal-employees/

https://www.whitehouse.gov/articles/2025/07/president-trumps-one-big-beautiful-bill-is-now-the-law/

https://www.cnbc.com/2025/07/11/when-provisions-from-trumps-big-beautiful-bill-go-into-effect.html

https://www.npr.org/2025/07/11/nx-s1-5459955/social-security-megabill-trump-tax-cuts

https://www.calt.iastate.edu/blogpost/one-big-beautiful-bill-act-implements-significant-tax-package


Mitch Zacks – Weekly Market Commentary: Are Investors Becoming Too Complacent?

By Weekly Market Commentary

A handful of trade deals have materialized, and the most severe elements of the ‘trade war’ have been dialed down. But we still inhabit a world of economic uncertainty.

The U.S.’s effective tariff rate is substantially higher than it was six months ago, the U.S. and China have yet to reach a trade agreement, and new tariffs and economic policies continue to surface. Businesses are still trying to make sense of the shifting policy landscape, which is a factor that can impede long-term planning and investment.

And yet, stocks keep rallying.

In previous columns, I’ve offered a few explanations for the strong performance off April lows. In the first four months of the year, fears about tariffs were disproportionately high. Then we got the 90-day pause, more extensions, a few deals, and dialed down tariff rates. The entire episode registered to markets as a series of “better-than-expected” outcomes, which almost always drives stocks higher. I’ve written it many times—stocks love to climb the wall of worry.1

But the market’s strength in recent weeks looks a bit different.

There is still plenty of uncertainty regarding effective tariff rates and sectors that may be targeted, but investors seem largely unfazed by each new tariff announcement. Some market participants may be accepting that tariff rates will remain relatively high and that there will be no economic price to pay, now or in the future. But it could also be a sign of growing complacency, which if true, could be worrisome.

I’m not saying investors need to anticipate an economic downturn. I’ve recently written about the resilience of the U.S. economy, which could continue for years. I’m more concerned about investors ruling out even the possibility of an economic impact due to tariffs, assuming instead that everything is working, and will continue working, smoothly. From a sentiment perspective, this could lead to fading pessimism and growing optimism, which is another way of saying that the wall of worry may be shrinking. That’s usually a signal to look at the equity market more cautiously.

Perhaps the most “risk-on” segment of the market today is a familiar one: large-cap technology stocks. The rally we’ve seen recently gives the perception that all trade headwinds are gone, and it’s all clear from here. With big tech’s recent gains, the U.S. equity market is now the most concentrated it has been in over 50 years, with the top 10 stocks making up roughly 37% of the total market cap of the S&P 500 index. This concentration has grown much faster than the earnings those companies contribute to the index (28%), leaving one of the widest valuation and weighting gaps since 1970.

This is the type of strength investors should observe with caution. History shows that when concentration and relative valuations hit these kinds of extremes, like we saw in the late 1960s and the dot-com era, it often precedes a long stretch of underperformance for the biggest names, with stronger relative returns for the rest of the market (in this case, “the other 490”). In fact, during the most concentrated third of historical market conditions (top 10 stocks at 23–39% of index weight), the equal-weighted bottom 490 outperformed the top 10 in 88% of rolling five-year periods.

Again, I don’t mean to fire a warning signal. Big technology companies could continue to deliver, and AI’s impact on the economy and profits could be even bigger than many are anticipating. But history tells us the path is never a straight line, and leadership at this scale will be difficult to sustain over the long term.

For investors, I think it’s a reason to check your portfolio’s balance. In environments like this, trimming back some of the biggest winners, taking profits, and reallocating to areas with better value can reduce risk without sacrificing long-term upside.

Bottom Line for Investors

I’m not ready to declare that optimism is giving way to euphoria in markets today. There are still plenty of skeptics, and I think tariff uncertainty is still meaningful to a healthy segment of investors. But when optimism starts to take hold across the board, especially without a material improvement in underlying economic conditions, history suggests that caution is warranted. Our team is watching these signals closely.

As far as big tech’s outperformance, markets can stay concentrated for a while, and economic data can remain choppy without derailing a bull market. But when leadership narrows, valuations stretch, and the economic picture is cloudy, I’d expect conditions to get a bit choppier. We continue to rebalance portfolios and diversify into attractively valued areas, all while staying disciplined.

CFA Institute. April 2, 2025. https://advisor.zacksim.com/e/376582/-decades–mod-djemMoneyBeat-us/5tfmhj/1292261589/h/H6rBn980PI156pgSyq0LCDT8kGec5YoTBEtC0KK9FcA

DISCLOSURE
Past performance is no guarantee of future results. Inherent in any investment is the potential for loss.

Zacks Investment Management, Inc. is a wholly-owned subsidiary of Zacks Investment Research. Zacks Investment Management is an independent Registered Investment Advisory firm and acts as an investment manager for individuals and institutions. Zacks Investment Research is a provider of earnings data and other financial data to institutions and to individuals.

This material is being provided for informational purposes only and nothing herein constitutes investment, legal, accounting or tax advice, or a recommendation to buy, sell or hold a security. Do not act or rely upon the information and advice given in this publication without seeking the services of competent and professional legal, tax, or accounting counsel. Publication and distribution of this article is not intended to create, and the information contained herein does not constitute, an attorney-client relationship. No recommendation or advice is being given as to whether any investment or strategy is suitable for a particular investor. It should not be assumed that any investments in securities, companies, sectors or markets identified and described were or will be profitable. All information is current as of the date of herein and is subject to change without notice. Any views or opinions expressed may not reflect those of the firm as a whole.

Any projections, targets, or estimates in this report are forward looking statements and are based on the firm’s research, analysis, and assumptions. Due to rapidly changing market conditions and the complexity of investment decisions, supplemental information and other sources may be required to make informed investment decisions based on your individual investment objectives and suitability specifications. All expressions of opinions are subject to change without notice. Clients should seek financial advice regarding the appropriateness of investing in any security or investment strategy discussed in this presentation.

Certain economic and market information contained herein has been obtained from published sources prepared by other parties.  Zacks Investment Management does not assume any responsibility for the accuracy or completeness of such information. Further, no third party has assumed responsibility for independently verifying the information contained herein and accordingly no such persons make any representations with respect to the accuracy, completeness or reasonableness of the information provided herein. Unless otherwise indicated, market analysis and conclusions are based upon opinions or assumptions that Zacks Investment Management considers to be reasonable. Any investment inherently involves a high degree of risk, beyond any specific risks discussed herein.

The S&P 500 Index is a well-known, unmanaged index of the prices of 500 large-company common stocks, mainly blue-chip stocks, selected by Standard & Poor’s. The S&P 500 Index assumes reinvestment of dividends but does not reflect advisory fees. The volatility of the benchmark may be materially different from the individual performance obtained by a specific investor. An investor cannot invest directly in an index.

The Russell 1000 Growth Index is a well-known, unmanaged index of the prices of 1000 large-company growth common stocks selected by Russell. The Russell 1000 Growth Index assumes reinvestment of dividends but does not reflect advisory fees. An investor cannot invest directly in an index. The volatility of the benchmark may be materially different from the individual performance obtained by a specific investor.

Nasdaq Composite Index is the market capitalization-weighted index of over 3,300 common equities listed on the Nasdaq stock exchange. The types of securities in the index include American depositary receipts, common stocks, real estate investment trusts (REITs) and tracking stocks, as well as limited partnership interests. The index includes all Nasdaq-listed stocks that are not derivatives, preferred shares, funds, exchange-traded funds (ETFs) or debenture securities. An investor cannot invest directly in an index. The volatility of the benchmark may be materially different from the individual performance obtained by a specific investor.

The Dow Jones Industrial Average measures the daily stock market movements of 30 U.S. publicly-traded companies listed on the NASDAQ or the New York Stock Exchange (NYSE). The 30 publicly-owned companies are considered leaders in the United States economy. An investor cannot directly invest in an index.  The volatility of the benchmark may be materially different from the individual performance obtained by a specific investor.

The Bloomberg Global Aggregate Index is a flagship measure of global investment grade debt from twenty-four local currency markets. This multi-currency benchmark includes treasury, government-related, corporate and securitized fixed-rate bonds from both developed and emerging markets issuers. An investor cannot invest directly in an index. The volatility of the benchmark may be materially different from the individual performance obtained by a specific investor.

The ICE Exchange-Listed Fixed & Adjustable Rate Preferred Securities Index is a modified market capitalization weighted index composed of preferred stock and securities that are functionally equivalent to preferred stock including, but not limited to, depositary preferred securities, perpetual subordinated debt and certain securities issued by banks and other financial institutions that are eligible for capital treatment with respect to such instruments akin to that received for issuance of straight preferred stock. An investor cannot invest directly in an index. The volatility of the benchmark may be materially different from the individual performance obtained by a specific investor.

The MSCI ACWI ex U.S. Index captures large and mid-cap representation across 22 of 23 Developed Markets (DM) countries (excluding the United States) and 24 Emerging Markets (EM) countries. The index covers approximately 85% of the global equity opportunity set outside the U.S. An investor cannot invest directly in an index. The volatility of the benchmark may be materially different from the individual performance obtained by a specific investor.

The Russell 2000 Index is a well-known, unmanaged index of the prices of 2000 small-cap company common stocks, selected by Russell. The Russell 2000 Index assumes reinvestment of dividends but does not reflect advisory fees. An investor cannot invest directly in an index. The volatility of the benchmark may be materially different from the individual performance obtained by a specific investor.

The S&P Mid Cap 400 provides investors with a benchmark for mid-sized companies. The index, which is distinct from the large-cap S&P 500, is designed to measure the performance of 400 mid-sized companies, reflecting the distinctive risk and return characteristics of this market segment.

The S&P 500 Pure Value index is a style-concentrated index designed to track the performance of stocks that exhibit the strongest value characteristics by using a style-attractiveness-weighting scheme. An investor cannot directly invest in an index.  The volatility of the benchmark may be materially different from the individual performance obtained by a specific investor.

Mitch Zacks – Weekly Market Commentary: The Leading Economic Index (LEI) Keeps Flashing Warning Signals

By Weekly Market Commentary

In June, The Conference Board’s Leading Economic Index (LEI) fell -0.3% month-over-month, marking the sharpest drop since February and adding to over two years of successive declines. Readers can see in the chart below that LEI has been in a near-freefall since early 2022.1

Historically speaking, these consecutive LEI declines would be a troubling sign for the U.S. economy. The index is designed to be a predictive tool, built on 10 components ranging from unemployment claims to building permits to stock prices. As seen above, the past three recessions have all been preceded by a LEI that tops out and rolls over.

Yet here we are, two years removed from LEI’s peak and subsequent declines, with no recession on the books or in sight.

Does this mean LEI is no longer a reliable indicator for the U.S. economy, meaning we should ignore it altogether when making macroeconomic forecasts? Not necessarily, in my view. There’s some context that matters here.

The first big piece is taking into account pandemic distortions. As readers may recall, lockdowns and massive fiscal stimulus (in the form of direct transfers) pulled forward demand for physical goods, which created an unnatural spike in the manufacturing sector. Among the components of the LEI are average weekly hours in manufacturing, new orders, and building permits, which are all geared toward manufacturing and goods-producing sectors.

The issue here is that the manufacturing hangover (post-pandemic) has been a major drag on LEI, even though the sector accounts for less than 20% of U.S. GDP. The U.S. is a services-based economy, and there is not much services-based economic data that goes into the LEI calculation.

The skew here matters. In recent readings, much of the weakness in the LEI comes from falling new orders in manufacturing, declining average work hours, and a slight uptick in jobless claims. Meanwhile, the U.S. services economy, including consumer spending, healthcare, technology, and financial services, continues to hold up solidly. This helps explain why LEI has been in decline since mid-2022, even as U.S. GDP has continued to grow.

Another factor is the yield curve. LEI includes the interest rate spread between 10-year and fed funds rates, which has been inverted for much of the last two years (see chart below). Historically, an inverted yield curve has been a reliable recession signal, as relatively high borrowing rates can give way to a credit crunch. But banks today are still sitting on excess deposits from the pandemic era, muting the need to borrow at high short-term rates. Lending has slowed, but we’re not seeing a collapse.

I still think the LEI is a useful indicator for investors to track, even though its ability to predict recession has not panned out in this cycle. It’s an index that’s constantly evolving; the Conference Board revamped it in 2012 and removed outdated inputs like the M2 money supply and the University of Michigan sentiment index. Even earlier, in 1996, materials prices and manufacturers’ unfilled orders were replaced with the yield curve, reflecting changes in how we’ve come to understand economic inflection points.

Bottom Line for Investors

The trend in the LEI is worth watching going forward, but I don’t think we’re in a place where ‘it’s just a matter of time’ before the recession arrives. Much of the LEI’s current weakness reflects narrow slices of the economy that are not effectively capturing the full picture. Services remain strong, consumers are still spending, and corporate profits are holding up. These drivers represent the lion’s share of output.

The key for market watchers is to treat LEI like one data point of many that you use to make forecasts and ‘check the pulse’ of the U.S. economy. No one indicator is sacrosanct or all-predicting.

1 Wall Street Journal. July 21, 2025.

2 Conference Board. 2025. https://advisor.zacksim.com/e/376582/topics-us-leading-indicators-/5tdn4y/1286248270/h/8i0_CYHlAFEcPbSgvN48QvtwBHi6SRBJWpGhW04JHho

3 Fred Economic Data. August 5, 2025. https://advisor.zacksim.com/e/376582/series-T10Y3M-/5tdn52/1286248270/h/8i0_CYHlAFEcPbSgvN48QvtwBHi6SRBJWpGhW04JHho

DISCLOSURE
Past performance is no guarantee of future results. Inherent in any investment is the potential for loss.

Zacks Investment Management, Inc. is a wholly-owned subsidiary of Zacks Investment Research. Zacks Investment Management is an independent Registered Investment Advisory firm and acts as an investment manager for individuals and institutions. Zacks Investment Research is a provider of earnings data and other financial data to institutions and to individuals.

This material is being provided for informational purposes only and nothing herein constitutes investment, legal, accounting or tax advice, or a recommendation to buy, sell or hold a security. Do not act or rely upon the information and advice given in this publication without seeking the services of competent and professional legal, tax, or accounting counsel. Publication and distribution of this article is not intended to create, and the information contained herein does not constitute, an attorney-client relationship. No recommendation or advice is being given as to whether any investment or strategy is suitable for a particular investor. It should not be assumed that any investments in securities, companies, sectors or markets identified and described were or will be profitable. All information is current as of the date of herein and is subject to change without notice. Any views or opinions expressed may not reflect those of the firm as a whole.

Any projections, targets, or estimates in this report are forward looking statements and are based on the firm’s research, analysis, and assumptions. Due to rapidly changing market conditions and the complexity of investment decisions, supplemental information and other sources may be required to make informed investment decisions based on your individual investment objectives and suitability specifications. All expressions of opinions are subject to change without notice. Clients should seek financial advice regarding the appropriateness of investing in any security or investment strategy discussed in this presentation.

Certain economic and market information contained herein has been obtained from published sources prepared by other parties.  Zacks Investment Management does not assume any responsibility for the accuracy or completeness of such information. Further, no third party has assumed responsibility for independently verifying the information contained herein and accordingly no such persons make any representations with respect to the accuracy, completeness or reasonableness of the information provided herein. Unless otherwise indicated, market analysis and conclusions are based upon opinions or assumptions that Zacks Investment Management considers to be reasonable. Any investment inherently involves a high degree of risk, beyond any specific risks discussed herein.

The S&P 500 Index is a well-known, unmanaged index of the prices of 500 large-company common stocks, mainly blue-chip stocks, selected by Standard & Poor’s. The S&P 500 Index assumes reinvestment of dividends but does not reflect advisory fees. The volatility of the benchmark may be materially different from the individual performance obtained by a specific investor. An investor cannot invest directly in an index.

The Russell 1000 Growth Index is a well-known, unmanaged index of the prices of 1000 large-company growth common stocks selected by Russell. The Russell 1000 Growth Index assumes reinvestment of dividends but does not reflect advisory fees. An investor cannot invest directly in an index. The volatility of the benchmark may be materially different from the individual performance obtained by a specific investor.

Nasdaq Composite Index is the market capitalization-weighted index of over 3,300 common equities listed on the Nasdaq stock exchange. The types of securities in the index include American depositary receipts, common stocks, real estate investment trusts (REITs) and tracking stocks, as well as limited partnership interests. The index includes all Nasdaq-listed stocks that are not derivatives, preferred shares, funds, exchange-traded funds (ETFs) or debenture securities. An investor cannot invest directly in an index. The volatility of the benchmark may be materially different from the individual performance obtained by a specific investor.

The Dow Jones Industrial Average measures the daily stock market movements of 30 U.S. publicly-traded companies listed on the NASDAQ or the New York Stock Exchange (NYSE). The 30 publicly-owned companies are considered leaders in the United States economy. An investor cannot directly invest in an index.  The volatility of the benchmark may be materially different from the individual performance obtained by a specific investor.

The Bloomberg Global Aggregate Index is a flagship measure of global investment grade debt from twenty-four local currency markets. This multi-currency benchmark includes treasury, government-related, corporate and securitized fixed-rate bonds from both developed and emerging markets issuers. An investor cannot invest directly in an index. The volatility of the benchmark may be materially different from the individual performance obtained by a specific investor.

The ICE Exchange-Listed Fixed & Adjustable Rate Preferred Securities Index is a modified market capitalization weighted index composed of preferred stock and securities that are functionally equivalent to preferred stock including, but not limited to, depositary preferred securities, perpetual subordinated debt and certain securities issued by banks and other financial institutions that are eligible for capital treatment with respect to such instruments akin to that received for issuance of straight preferred stock. An investor cannot invest directly in an index. The volatility of the benchmark may be materially different from the individual performance obtained by a specific investor.

The MSCI ACWI ex U.S. Index captures large and mid-cap representation across 22 of 23 Developed Markets (DM) countries (excluding the United States) and 24 Emerging Markets (EM) countries. The index covers approximately 85% of the global equity opportunity set outside the U.S. An investor cannot invest directly in an index. The volatility of the benchmark may be materially different from the individual performance obtained by a specific investor.

The Russell 2000 Index is a well-known, unmanaged index of the prices of 2000 small-cap company common stocks, selected by Russell. The Russell 2000 Index assumes reinvestment of dividends but does not reflect advisory fees. An investor cannot invest directly in an index. The volatility of the benchmark may be materially different from the individual performance obtained by a specific investor.

The S&P Mid Cap 400 provides investors with a benchmark for mid-sized companies. The index, which is distinct from the large-cap S&P 500, is designed to measure the performance of 400 mid-sized companies, reflecting the distinctive risk and return characteristics of this market segment.

The S&P 500 Pure Value index is a style-concentrated index designed to track the performance of stocks that exhibit the strongest value characteristics by using a style-attractiveness-weighting scheme. An investor cannot directly invest in an index.  The volatility of the benchmark may be materially different from the individual performance obtained by a specific investor.

Mitch Zacks – Weekly Market Commentary: Global Economic Resilience Driving Markets Up—So Far

By Weekly Market Commentary

How Global Economic Resilience is Driving Markets

At the turn of the year, we knew tariffs were going to be a key factor in the global economic growth story. Just how much of a factor was unclear.  

Fast forward to today, and I think it’s fair to say that the uncertainty surrounding trade policy went far higher than many expected, while the global economic fallout was far more muted than many anticipated (at least so far). A high-level takeaway is clear: the global economy has once again shown that it’s capable of absorbing shocks.1

The facts bear this out. Early estimates indicate that the global economy grew at a 2.4% annual rate in the first half of 2025, roughly matching its long-term trend. The IMF and World Bank have also both upgraded their full-year global growth forecasts in recent months, and we recently saw that world merchandise trade volumes rose 5.3% year-over-year in the first quarter, surprising to the upside. These are not data one would expect to accompany a global ‘trade war.’

Global economic resilience has also been reflected in business surveys. The S&P Global U.S. Composite PMI hit 54.6 in July, which is its fastest expansion rate this year. In the eurozone, PMIs have remained in expansion territory, with Germany’s new manufacturing orders recently rising at the fastest in three years. And PMI data for Japan, India, and Australia point to continued expansion. Remember, these are all countries that have been targeted with higher tariffs.

A major theme underpinning this resilience is how companies and supply chains have adapted. Businesses accelerated purchases to beat tariff deadlines (“front-loading”), rerouted exports through countries with lower tariffs, and shifted production closer to end markets—strategies honed during the pandemic. U.S. imports from Southeast Asia jumped 28% year-over-year in the first four months of 2025, and overall Chinese exports, despite falling to the U.S., rose 6% thanks to growth in Asia, Europe, and Africa.

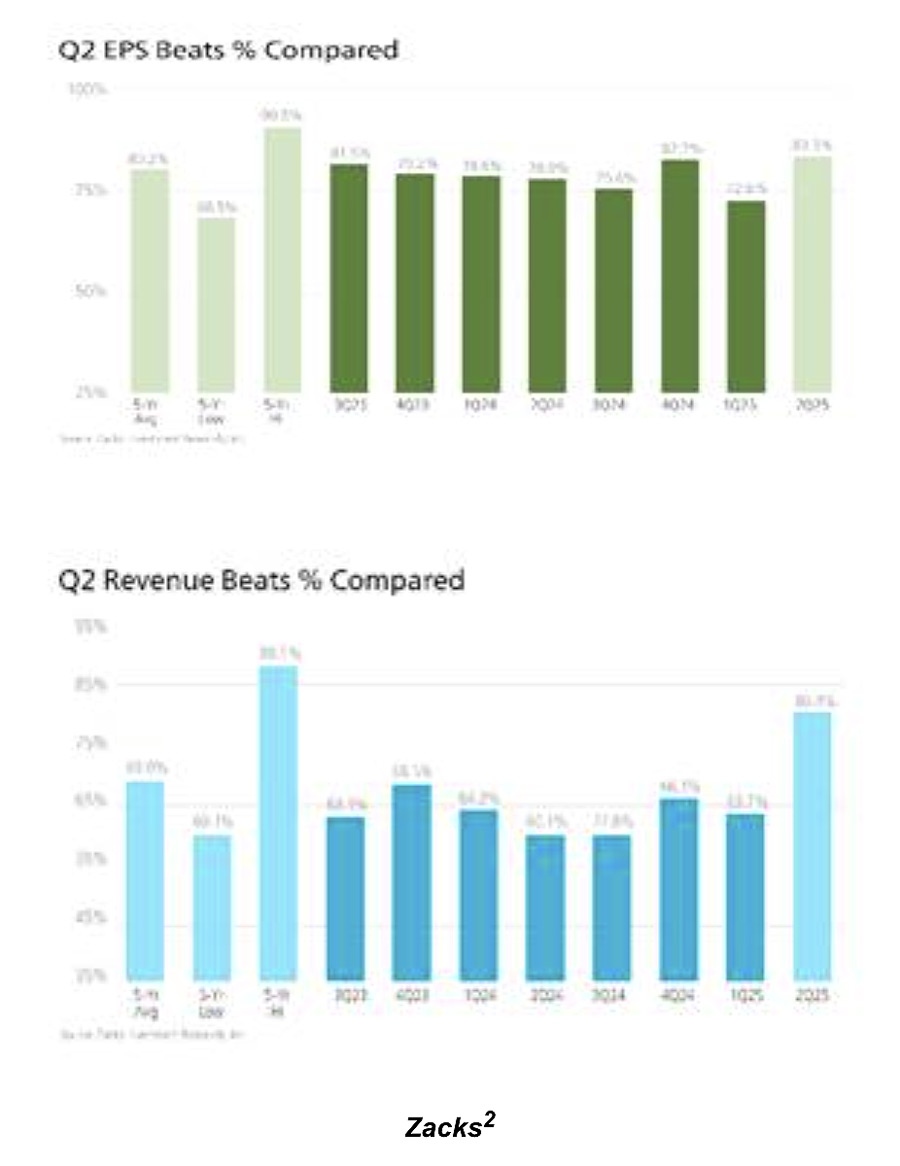
We’re also seeing fundamental strength in U.S. corporate earnings. As I write, S&P 500 companies have posted 8.3% earnings-per-share (EPS) growth on 4.9% higher revenues in Q2 2025. But the key metric is that 83.3% of reporting companies have beaten EPS estimates, and 80.4% have beaten revenue estimates. These ‘beats percentages’ are tracking notably above the historical averages for this group of reporting companies, as the comparison charts below show.

In my view, this resilience has fed into the sustained equity market rally. The ability of companies to navigate tariffs—whether it’s from passing on costs, shifting suppliers, or absorbing margin pressure—has made earnings season better-than-expected and provided a tailwind for stocks in the process.

As I’ve written many times before, markets do not need perfect conditions to move higher. They just need things to be less bad than feared, which is what I think we’re seeing today. Many investors braced for a negative shock months ago, which set the bar for a positive surprise very low. But as evidenced by global economic fundamentals we’re observing now, the tariff impact so far has been far less damaging than most expected, which has markets responding accordingly.

Bottom Line for Investors

The market has spent much of 2025 pricing in trade disruptions, geopolitical uncertainty, and the potential for slower global growth. But reality looks much different than the worst fears. Businesses are adapting, consumers are spending, and governments around the world have been engaging in fiscal and in some cases, monetary stimulus. In short, the global economy is navigating the tariff upheaval in stride.

This resilience has been welcomed, but to be fair its sustainability is not assured. Much recent strength reflects one-off factors—like inventory buildup and pre-tariff stockpiling—which could unwind in the months ahead. Survey data and central bank commentary (e.g., from the ECB and the Fed) suggest demand could cool, especially in the eurozone, if exports to the U.S. fall sharply. Watching data closely in the coming months will be crucial, in my view.

For now, I think it’s fair to say that the risks tied to the trade war have likely been overestimated. Economic resilience has been the bigger theme, and it also so happens to be one of the most important forces that drives markets over time.

Wall Street Journal. July 21, 2025. https://advisor.zacksim.com/e/376582/-b2c1824a-mod-djemMoneyBeat-us/5tcwpt/1280980407/h/855hLOE5hsmyjbsXVf-7n_q0Q7yQg_3gbc0jTrm2E2A

Zacks.com July 25, 2025. https://advisor.zacksim.com/e/376582/loom-what-can-investors-expect/5tcwpx/1280980407/h/855hLOE5hsmyjbsXVf-7n_q0Q7yQg_3gbc0jTrm2E2A

DISCLOSURE
Past performance is no guarantee of future results. Inherent in any investment is the potential for loss.

Zacks Investment Management, Inc. is a wholly-owned subsidiary of Zacks Investment Research. Zacks Investment Management is an independent Registered Investment Advisory firm and acts as an investment manager for individuals and institutions. Zacks Investment Research is a provider of earnings data and other financial data to institutions and to individuals.

This material is being provided for informational purposes only and nothing herein constitutes investment, legal, accounting or tax advice, or a recommendation to buy, sell or hold a security. Do not act or rely upon the information and advice given in this publication without seeking the services of competent and professional legal, tax, or accounting counsel. Publication and distribution of this article is not intended to create, and the information contained herein does not constitute, an attorney-client relationship. No recommendation or advice is being given as to whether any investment or strategy is suitable for a particular investor. It should not be assumed that any investments in securities, companies, sectors or markets identified and described were or will be profitable. All information is current as of the date of herein and is subject to change without notice. Any views or opinions expressed may not reflect those of the firm as a whole.

Any projections, targets, or estimates in this report are forward looking statements and are based on the firm’s research, analysis, and assumptions. Due to rapidly changing market conditions and the complexity of investment decisions, supplemental information and other sources may be required to make informed investment decisions based on your individual investment objectives and suitability specifications. All expressions of opinions are subject to change without notice. Clients should seek financial advice regarding the appropriateness of investing in any security or investment strategy discussed in this presentation.

Certain economic and market information contained herein has been obtained from published sources prepared by other parties.  Zacks Investment Management does not assume any responsibility for the accuracy or completeness of such information. Further, no third party has assumed responsibility for independently verifying the information contained herein and accordingly no such persons make any representations with respect to the accuracy, completeness or reasonableness of the information provided herein. Unless otherwise indicated, market analysis and conclusions are based upon opinions or assumptions that Zacks Investment Management considers to be reasonable. Any investment inherently involves a high degree of risk, beyond any specific risks discussed herein.

The S&P 500 Index is a well-known, unmanaged index of the prices of 500 large-company common stocks, mainly blue-chip stocks, selected by Standard & Poor’s. The S&P 500 Index assumes reinvestment of dividends but does not reflect advisory fees. The volatility of the benchmark may be materially different from the individual performance obtained by a specific investor. An investor cannot invest directly in an index.

The Russell 1000 Growth Index is a well-known, unmanaged index of the prices of 1000 large-company growth common stocks selected by Russell. The Russell 1000 Growth Index assumes reinvestment of dividends but does not reflect advisory fees. An investor cannot invest directly in an index. The volatility of the benchmark may be materially different from the individual performance obtained by a specific investor.

Nasdaq Composite Index is the market capitalization-weighted index of over 3,300 common equities listed on the Nasdaq stock exchange. The types of securities in the index include American depositary receipts, common stocks, real estate investment trusts (REITs) and tracking stocks, as well as limited partnership interests. The index includes all Nasdaq-listed stocks that are not derivatives, preferred shares, funds, exchange-traded funds (ETFs) or debenture securities. An investor cannot invest directly in an index. The volatility of the benchmark may be materially different from the individual performance obtained by a specific investor.

The Dow Jones Industrial Average measures the daily stock market movements of 30 U.S. publicly-traded companies listed on the NASDAQ or the New York Stock Exchange (NYSE). The 30 publicly-owned companies are considered leaders in the United States economy. An investor cannot directly invest in an index.  The volatility of the benchmark may be materially different from the individual performance obtained by a specific investor.

The Bloomberg Global Aggregate Index is a flagship measure of global investment grade debt from twenty-four local currency markets. This multi-currency benchmark includes treasury, government-related, corporate and securitized fixed-rate bonds from both developed and emerging markets issuers. An investor cannot invest directly in an index. The volatility of the benchmark may be materially different from the individual performance obtained by a specific investor.

The ICE Exchange-Listed Fixed & Adjustable Rate Preferred Securities Index is a modified market capitalization weighted index composed of preferred stock and securities that are functionally equivalent to preferred stock including, but not limited to, depositary preferred securities, perpetual subordinated debt and certain securities issued by banks and other financial institutions that are eligible for capital treatment with respect to such instruments akin to that received for issuance of straight preferred stock. An investor cannot invest directly in an index. The volatility of the benchmark may be materially different from the individual performance obtained by a specific investor.

The MSCI ACWI ex U.S. Index captures large and mid-cap representation across 22 of 23 Developed Markets (DM) countries (excluding the United States) and 24 Emerging Markets (EM) countries. The index covers approximately 85% of the global equity opportunity set outside the U.S. An investor cannot invest directly in an index. The volatility of the benchmark may be materially different from the individual performance obtained by a specific investor.

The Russell 2000 Index is a well-known, unmanaged index of the prices of 2000 small-cap company common stocks, selected by Russell. The Russell 2000 Index assumes reinvestment of dividends but does not reflect advisory fees. An investor cannot invest directly in an index. The volatility of the benchmark may be materially different from the individual performance obtained by a specific investor.

The S&P Mid Cap 400 provides investors with a benchmark for mid-sized companies. The index, which is distinct from the large-cap S&P 500, is designed to measure the performance of 400 mid-sized companies, reflecting the distinctive risk and return characteristics of this market segment.

The S&P 500 Pure Value index is a style-concentrated index designed to track the performance of stocks that exhibit the strongest value characteristics by using a style-attractiveness-weighting scheme. An investor cannot directly invest in an index.  The volatility of the benchmark may be materially different from the individual performance obtained by a specific investor.