Monthly Archives

October 2025

Medicare

How Medicare Works

By Financial Planning, Retirement Planning

In order to start to understand how Medicare works, it’s helpful to have a bit of background. Both the Medicare and Medicaid programs were signed into law in 1965 by President Lyndon B. Johnson to provide basic health services for Americans who didn’t have health insurance. Medicare was designed for retirees, while Medicaid was designed for low-income individuals and families, minor children, and people with disabilities. Fast forward to today.

The Sign-Up Period for Medicare

For people turning 65 who are retired or considering retirement, signing up for Medicare comes with deadlines. You must sign up for Medicare within a seven-month window—the time period three months before, the month you turn 65, and three months after—or pay late enrollment fees which are often permanent and go up the longer you wait. The only exception is for people who are still working (or whose spouse is still working) and have health insurance coverage through an employer with 50 or more employees that qualifies as creditable coverage by Medicare. Even if you have coverage through work, when you turn 65 it is advisable to go ahead and sign up for Medicare Part A because it’s free for most people who qualify.

Medicare Doesn’t Provide Long-Term Custodial Care

As it has evolved through time, Medicaid provides long-term care services, not Medicare. Medicare Part A covers up to 100 days of care for approved rehabilitation or medical treatment, but it does not cover ongoing custodial care needed for things like dressing, bathing, going to the bathroom, and other help required by the elderly, disabled, or those with dementia. Eligibility rules vary by state, but in general, in order to qualify for Medicaid for long-term or nursing care you must have a need for constant care, have very limited physical ability, and spend down all assets to total around $2,000 or less. The need for spend-down has taken many families and spouses by surprise during a time of crisis, potentially leaving them with nothing. In some cases, a spouse may even be forced to divorce in order to continue to have the assets needed for living expenses. The average cost for long-term custodial care in a semi-private room in a nursing facility in 2024 was more than $9,000 per month!

The Parts A, B, C, and D of Medicare

  • Part A (Hospital Insurance): Covers inpatient hospital stays, skilled nursing facility care, hospice care, and limited home health care. This is normally free for most people who have qualified for Medicare coverage.
  • Part B (Medical Insurance): Covers doctor visits, outpatient care, home health care, and preventive services like screenings and wellness visits, along with durable medical equipment (e.g., wheelchairs). Part B coverage is the premium that will be deducted from your Social Security check if you don’t choose Medigap or Part C.
  • Part D (Prescription Drug Coverage): Helps cover the cost of prescription medications, including certain vaccines. You can get Part D as a standalone plan along with Part B or as part of a Medicare Advantage Plan.
  • Medicare Supplemental Insurance (Medigap): Extra coverage from private insurers to help pay for out-of-pocket costs in Original Medicare, such as copayments and coinsurance. Plans are standardized by letter (e.g., Plan G, Plan K).
  • Part C (Medicare Advantage Plans): Private, Medicare-approved plans that may bundle Part A, Part B, and often Part D (prescription drug) coverages. Usually limited to providers within the plan’s network. May have different out-of-pocket costs and additional benefits not available in Original Medicare, like vision and hearing coverage.

                Comparing Your Choice of Original Medicare with Medicare Advantage Part C Plans

Original Medicare

  • Includes Part A and Part B.
  • Option to add Part D for prescription coverage.
  • Flexibility to see any Medicare-accepting provider in the U.S.
  • You can also add supplemental Medigap for extra coverage on costs not covered by Original Medicare.
Medicare Advantage (Part C)

  • Private, Medicare-approved plans that bundle Part A, Part B, and often Part D (prescription drug) coverages.
  • Usually limited to providers within the plan’s network.
  • May have different out-of-pocket costs and additional benefits not available in Original Medicare, like vision and hearing coverage.

Medicare Is Not Free

Fidelity’s 2025 retiree health care cost estimate for an individual 65 or older is $172,500, which includes expected Medicare premiums, out-of-pocket costs, and services not covered by original Medicare. The estimate does not include costs such as dental care, vision care, over-the-counter medications, or long-term care, which are significant out-of-pocket expenses not covered by original Medicare.

Medicare Costs More For Higher Income People With a 2-Year Lookback

One thing that will have a big impact on your Medicare costs is your modified adjusted gross income (MAGI). Once you retire, you may be surprised to find that a combination of income from pensions, investment earnings, traditional (non-Roth) IRA withdrawals, and traditional 401(k) withdrawals may land you with a higher MAGI than you realized. While you may no longer be earning a traditional income from working a job, your MAGI will still reflect all of your taxable income. For 2025, the monthly premium per person for Medicare Part B for those with MAGIs of $106,000 or less in the 2023 tax year is $185 per month. At the highest income bracket for Medicare, the monthly Part B premium is $628.90 per person.


If you would like to discuss Medicare as part of your overall retirement plan, call us at least five to 10 years before you plan to retire! Call us to learn more about life insurance! You can reach BayTrust Financial in Tampa at 813.820.0069.


All information contained herein is derived from sources deemed to be reliable but cannot be guaranteed. All views/opinions expressed in this newsletter are solely those of the author and do not reflect the views/opinions held by Advisory Services Network, LLC.


Sources:

https://www.cms.gov/about-cms/who-we-are/history

https://www.medicare.gov/basics/costs/medicare-costs/avoid-penalties

https://www.medicare.gov/

https://www.ncoa.org/article/does-medicare-cover-nursing-homes-what-older-adults-and-caregivers-should-know/

https://www.medicaidplanningassistance.org/medicaid-divorce/

https://www.carescout.com/cost-of-care

https://newsroom.fidelity.com/pressreleases/fidelity-investments–releases-2025-retiree-health-care-cost-estimate–a-timely-reminder-for-all-gen/s/3c62e988-12e2-4dc8-afb4-f44b06c6d52e

Mitch Zacks – Weekly Market Commentary: Why Markets Rarely Flinch at Government Shutdowns

By Weekly Market Commentary

Why Markets Rarely Flinch at Government Shutdowns

As readers are well aware, the U.S. government officially shut down after lawmakers failed to reach a funding deal. To date, paychecks for hundreds of thousands of federal employees have been paused, and some national parks and agencies have been shuttered, including the Bureau of Labor Statistics, which supplies jobs and inflation data.

Government shutdowns almost always get constant media attention, perhaps understandably so. They are disruptive and create plenty of short-term uncertainty.1

But for investors, they need not be a source of stress or urgent concern. History tells us, quite clearly, that shutdowns have not been a source of meaningful and certainly not lasting economic impact.

Since 1976, there have been more than 20 shutdowns of varying lengths. None has caused a recession. None has triggered a bear market. And in many cases, stocks moved higher during the shutdown and in the months immediately after. The longest shutdown on record, 35 days spanning late 2018 into early 2019, coincided with a strong equity rally.

If we parse out the data even more, going back to all shutdowns since 1976, we find that the S&P 500 was up an average of 12.1% in the year following a shutdown. In the second longest shutdown (21 days in late 1995 and early 1996), stocks went up 3.1% in the month after the shutdown, and +21.3% in the following year.

This is not to say shutdowns come without consequences and should be completely ignored. Hundreds of thousands of federal employees are furloughed without pay, while others, such as members of the military and air traffic controllers, continue working but receive their paychecks later. Businesses that depend on government contracts can see delays, and data collection also halts—which means key economic reports, including the monthly jobs and inflation data, are delayed. In an environment where the Federal Reserve is highly data-dependent, that could momentarily complicate monetary policy decisions.

Still, the broader economic footprint of a shutdown is surprisingly small. Most of the federal budget keeps flowing even when Washington hits a stalemate. Social Security, Medicare, and interest payments on U.S. debt continue, covering roughly three-quarters of total federal outlays. Mandatory programs don’t shut down. And when the government reopens, furloughed workers are paid retroactively, meaning much of the lost income and spending returns to the economy in short order.

For investors, that’s an important distinction. Shutdowns are inherently temporary, and markets know it. A federal funding impasse has yet to alter corporate earnings trends, long-term inflation trajectories, or consumer behavior in any meaningful way. In fact, markets often rise during shutdowns precisely because investors have seen this story before and know how it ends. The government eventually reopens, paychecks resume, and the economic data catch up.

Some commentators have worried about the potential for a shutdown to weigh on consumer confidence or market sentiment. That’s possible in the short term, especially if the headlines grow louder and political rhetoric intensifies. But even in those cases, the effect tends to fade quickly. The same pattern has repeated across decades, with temporary volatility followed by quick stabilization as markets refocus on fundamentals.

Bottom Line for Investors

The question for investors, then, is: are the economic fundamentals still strong enough for markets to look through the shutdown?

In my view, the answer is yes. Growth has moderated from last year’s pace, but the economy continues to expand. The jobs market is showing signs of leveling off, but unemployment remains low. Business investment remains solid, thanks in large part to AI investment, and corporate profits are holding up well. Our colleagues at Zacks Investment Research have been noting for some time now that forward estimates continue to trend higher, signaling confidence in corporate America. The U.S. financial system also remains in fine shape, with healthy lending activity in a monetary easing cycle.

In this kind of environment, it takes more than a political impasse to derail the broader trend.

Wall Street Journal. October 1, 2025. https://advisor.zacksim.com/e/376582/-mod-economy-more-article-pos2/5tp38p/1340471816/h/oHCC4EptMjDjKBX9l32s0Ez55oiv-jRLalL68_h0dWM

Fred Economic Data. October 6, 2025. https://advisor.zacksim.com/e/376582/series-SP500-/5tp38s/1340471816/h/oHCC4EptMjDjKBX9l32s0Ez55oiv-jRLalL68_h0dWM

DISCLOSURE
Past performance is no guarantee of future results. Inherent in any investment is the potential for loss.

Zacks Investment Management, Inc. is a wholly-owned subsidiary of Zacks Investment Research. Zacks Investment Management is an independent Registered Investment Advisory firm and acts as an investment manager for individuals and institutions. Zacks Investment Research is a provider of earnings data and other financial data to institutions and to individuals.

This material is being provided for informational purposes only and nothing herein constitutes investment, legal, accounting or tax advice, or a recommendation to buy, sell or hold a security. Do not act or rely upon the information and advice given in this publication without seeking the services of competent and professional legal, tax, or accounting counsel. Publication and distribution of this article is not intended to create, and the information contained herein does not constitute, an attorney-client relationship. No recommendation or advice is being given as to whether any investment or strategy is suitable for a particular investor. It should not be assumed that any investments in securities, companies, sectors or markets identified and described were or will be profitable. All information is current as of the date of herein and is subject to change without notice. Any views or opinions expressed may not reflect those of the firm as a whole.

Any projections, targets, or estimates in this report are forward looking statements and are based on the firm’s research, analysis, and assumptions. Due to rapidly changing market conditions and the complexity of investment decisions, supplemental information and other sources may be required to make informed investment decisions based on your individual investment objectives and suitability specifications. All expressions of opinions are subject to change without notice. Clients should seek financial advice regarding the appropriateness of investing in any security or investment strategy discussed in this presentation.

Certain economic and market information contained herein has been obtained from published sources prepared by other parties.  Zacks Investment Management does not assume any responsibility for the accuracy or completeness of such information. Further, no third party has assumed responsibility for independently verifying the information contained herein and accordingly no such persons make any representations with respect to the accuracy, completeness or reasonableness of the information provided herein. Unless otherwise indicated, market analysis and conclusions are based upon opinions or assumptions that Zacks Investment Management considers to be reasonable. Any investment inherently involves a high degree of risk, beyond any specific risks discussed herein.

The S&P 500 Index is a well-known, unmanaged index of the prices of 500 large-company common stocks, mainly blue-chip stocks, selected by Standard & Poor’s. The S&P 500 Index assumes reinvestment of dividends but does not reflect advisory fees. The volatility of the benchmark may be materially different from the individual performance obtained by a specific investor. An investor cannot invest directly in an index.

The Russell 1000 Growth Index is a well-known, unmanaged index of the prices of 1000 large-company growth common stocks selected by Russell. The Russell 1000 Growth Index assumes reinvestment of dividends but does not reflect advisory fees. An investor cannot invest directly in an index. The volatility of the benchmark may be materially different from the individual performance obtained by a specific investor.

Nasdaq Composite Index is the market capitalization-weighted index of over 3,300 common equities listed on the Nasdaq stock exchange. The types of securities in the index include American depositary receipts, common stocks, real estate investment trusts (REITs) and tracking stocks, as well as limited partnership interests. The index includes all Nasdaq-listed stocks that are not derivatives, preferred shares, funds, exchange-traded funds (ETFs) or debenture securities. An investor cannot invest directly in an index. The volatility of the benchmark may be materially different from the individual performance obtained by a specific investor.
The Dow Jones Industrial Average measures the daily stock market movements of 30 U.S. publicly-traded companies listed on the NASDAQ or the New York Stock Exchange (NYSE). The 30 publicly-owned companies are considered leaders in the United States economy. An investor cannot directly invest in an index.  The volatility of the benchmark may be materially different from the individual performance obtained by a specific investor.

The Bloomberg Global Aggregate Index is a flagship measure of global investment grade debt from twenty-four local currency markets. This multi-currency benchmark includes treasury, government-related, corporate and securitized fixed-rate bonds from both developed and emerging markets issuers. An investor cannot invest directly in an index. The volatility of the benchmark may be materially different from the individual performance obtained by a specific investor.

The ICE Exchange-Listed Fixed & Adjustable Rate Preferred Securities Index is a modified market capitalization weighted index composed of preferred stock and securities that are functionally equivalent to preferred stock including, but not limited to, depositary preferred securities, perpetual subordinated debt and certain securities issued by banks and other financial institutions that are eligible for capital treatment with respect to such instruments akin to that received for issuance of straight preferred stock. An investor cannot invest directly in an index. The volatility of the benchmark may be materially different from the individual performance obtained by a specific investor.

The MSCI ACWI ex U.S. Index captures large and mid-cap representation across 22 of 23 Developed Markets (DM) countries (excluding the United States) and 24 Emerging Markets (EM) countries. The index covers approximately 85% of the global equity opportunity set outside the U.S. An investor cannot invest directly in an index. The volatility of the benchmark may be materially different from the individual performance obtained by a specific investor.

The Russell 2000 Index is a well-known, unmanaged index of the prices of 2000 small-cap company common stocks, selected by Russell. The Russell 2000 Index assumes reinvestment of dividends but does not reflect advisory fees. An investor cannot invest directly in an index. The volatility of the benchmark may be materially different from the individual performance obtained by a specific investor.

The S&P Mid Cap 400 provides investors with a benchmark for mid-sized companies. The index, which is distinct from the large-cap S&P 500, is designed to measure the performance of 400 mid-sized companies, reflecting the distinctive risk and return characteristics of this market segment.

The S&P 500 Pure Value index is a style-concentrated index designed to track the performance of stocks that exhibit the strongest value characteristics by using a style-attractiveness-weighting scheme. An investor cannot directly invest in an index.  The volatility of the benchmark may be materially different from the individual performance obtained by a specific investor.

Mitch Zacks – Weekly Market Commentary: Will a Steepening Yield Curve Boost Financials and the Broader Economy?

By Weekly Market Commentary

Conditions for a steepening yield curve are forming.

The Federal Reserve cut its benchmark fed funds rate by 25 basis points at its September meeting, and there are indications that more rate cuts are on the horizon. If the next few meetings go as many market participants anticipate, yields on the short end of the curve are poised to keep falling.

Meanwhile, yields on the longer end of the curve (10-year and 30-year U.S. Treasurys) have been steadily climbing. As seen on the chart below, 30-year U.S. Treasury bond yields recently brushed 5%, and the 10-year has remained above 4% all year.

As I wrote in a recent column, there are a few reasons to believe we could see sustained pressure on long duration bond yields. Debt issuance has picked up after the summer lull, increasing supply. Sentiment could also play a role—after years of near-zero interest rates and heavy central bank buying, investors have grown more sensitive to small shifts in expectations about growth, inflation, and policy. Expectations of lower growth and higher inflation can push yields up.

In that same column, I framed this dynamic as a potential positive. I argued that with central banks cutting short-term rates and long yields drifting higher, yield curves could be set to steepen, which is a classic marker of healthier credit conditions since it improves incentives for banks to lend. Remember, the basic business model of banking relies on borrowing money at short-term rates and putting it to work through longer-term loans. When the yield curve slopes upward, long rates exceeding short, banks have higher incentive to extend credit widely because the margin is in their favor.

The chart below shows the yield curve as the difference between yields on 3-month U.S. Treasurys and 10-year U.S. Treasurys. It’s clear that the yield curve has been flat for some time, but as outlined above, there’s a reasonably good thesis that we could see more steepening ahead.

A steeper yield curve is generally good news, but I want to be careful not to portray it as a definitive game-changer.

Although the correlation is relatively tight, banks’ lending margins don’t map directly to government bond spreads. Banks’ funding costs are shaped more by the abundance of deposits, swollen in recent years by pandemic-era fiscal transfers, than by short-term Treasury yields. Loan pricing, meanwhile, generally runs above long-term government yields, reflecting higher credit risk. This helps explain why loan growth (see chart below) has remained steady even during the curve’s inversion. In other words, banks did not suddenly stop lending when the curve flipped upside down, so it’s unlikely that merely un-inverting will spark a dramatic new lending boom.

To be sure, a modestly positive slope can provide a tailwind for Financials stocks, and it may offer some incremental support to credit creation. But as a barometer for the U.S. economy overall, the curve’s current steepening is more symbolic than fundamental. The bigger picture is that lending activity never really faltered, and the economy has kept grinding ahead despite widespread worries.

Bottom Line for Investors
A steepening yield curve is positive, and it can add some support for Financials. But I do not think we’re in a place in this cycle where a steeper curve will fundamentally alter the economic outlook. The U.S. economy remains sturdier than many appreciate, with strong employment and steady loan growth underscoring that resilience. For investors, a steeper yield curve is something to celebrate, but it’s not a panacea for weakness that could emerge elsewhere in the economy.

Fred Economic Data. September 30, 2025. https://advisor.zacksim.com/e/376582/series-DGS10-/5tn8sy/1333099486/h/geOAQyKBeBZ__09SQgDnxopD9r5IOqVUKxnO9oVEqrE

Fred Economic Data. September 30, 2025. https://advisor.zacksim.com/e/376582/series-T10Y3M-/5tn8t5/1333099486/h/geOAQyKBeBZ__09SQgDnxopD9r5IOqVUKxnO9oVEqrE

Fred Economic Data. September 26, 2025. https://advisor.zacksim.com/e/376582/series-TOTLL/5tn8tc/1333099486/h/geOAQyKBeBZ__09SQgDnxopD9r5IOqVUKxnO9oVEqrE

DISCLOSURE
Past performance is no guarantee of future results. Inherent in any investment is the potential for loss.

Zacks Investment Management, Inc. is a wholly-owned subsidiary of Zacks Investment Research. Zacks Investment Management is an independent Registered Investment Advisory firm and acts as an investment manager for individuals and institutions. Zacks Investment Research is a provider of earnings data and other financial data to institutions and to individuals.

This material is being provided for informational purposes only and nothing herein constitutes investment, legal, accounting or tax advice, or a recommendation to buy, sell or hold a security. Do not act or rely upon the information and advice given in this publication without seeking the services of competent and professional legal, tax, or accounting counsel. Publication and distribution of this article is not intended to create, and the information contained herein does not constitute, an attorney-client relationship. No recommendation or advice is being given as to whether any investment or strategy is suitable for a particular investor. It should not be assumed that any investments in securities, companies, sectors or markets identified and described were or will be profitable. All information is current as of the date of herein and is subject to change without notice. Any views or opinions expressed may not reflect those of the firm as a whole.

Any projections, targets, or estimates in this report are forward looking statements and are based on the firm’s research, analysis, and assumptions. Due to rapidly changing market conditions and the complexity of investment decisions, supplemental information and other sources may be required to make informed investment decisions based on your individual investment objectives and suitability specifications. All expressions of opinions are subject to change without notice. Clients should seek financial advice regarding the appropriateness of investing in any security or investment strategy discussed in this presentation.

Certain economic and market information contained herein has been obtained from published sources prepared by other parties.  Zacks Investment Management does not assume any responsibility for the accuracy or completeness of such information. Further, no third party has assumed responsibility for independently verifying the information contained herein and accordingly no such persons make any representations with respect to the accuracy, completeness or reasonableness of the information provided herein. Unless otherwise indicated, market analysis and conclusions are based upon opinions or assumptions that Zacks Investment Management considers to be reasonable. Any investment inherently involves a high degree of risk, beyond any specific risks discussed herein.

The S&P 500 Index is a well-known, unmanaged index of the prices of 500 large-company common stocks, mainly blue-chip stocks, selected by Standard & Poor’s. The S&P 500 Index assumes reinvestment of dividends but does not reflect advisory fees. The volatility of the benchmark may be materially different from the individual performance obtained by a specific investor. An investor cannot invest directly in an index.

The Russell 1000 Growth Index is a well-known, unmanaged index of the prices of 1000 large-company growth common stocks selected by Russell. The Russell 1000 Growth Index assumes reinvestment of dividends but does not reflect advisory fees. An investor cannot invest directly in an index. The volatility of the benchmark may be materially different from the individual performance obtained by a specific investor.

Nasdaq Composite Index is the market capitalization-weighted index of over 3,300 common equities listed on the Nasdaq stock exchange. The types of securities in the index include American depositary receipts, common stocks, real estate investment trusts (REITs) and tracking stocks, as well as limited partnership interests. The index includes all Nasdaq-listed stocks that are not derivatives, preferred shares, funds, exchange-traded funds (ETFs) or debenture securities. An investor cannot invest directly in an index. The volatility of the benchmark may be materially different from the individual performance obtained by a specific investor.

The Dow Jones Industrial Average measures the daily stock market movements of 30 U.S. publicly-traded companies listed on the NASDAQ or the New York Stock Exchange (NYSE). The 30 publicly-owned companies are considered leaders in the United States economy. An investor cannot directly invest in an index.  The volatility of the benchmark may be materially different from the individual performance obtained by a specific investor.

The Bloomberg Global Aggregate Index is a flagship measure of global investment grade debt from twenty-four local currency markets. This multi-currency benchmark includes treasury, government-related, corporate and securitized fixed-rate bonds from both developed and emerging markets issuers. An investor cannot invest directly in an index. The volatility of the benchmark may be materially different from the individual performance obtained by a specific investor.

The ICE Exchange-Listed Fixed & Adjustable Rate Preferred Securities Index is a modified market capitalization weighted index composed of preferred stock and securities that are functionally equivalent to preferred stock including, but not limited to, depositary preferred securities, perpetual subordinated debt and certain securities issued by banks and other financial institutions that are eligible for capital treatment with respect to such instruments akin to that received for issuance of straight preferred stock. An investor cannot invest directly in an index. The volatility of the benchmark may be materially different from the individual performance obtained by a specific investor.

The MSCI ACWI ex U.S. Index captures large and mid-cap representation across 22 of 23 Developed Markets (DM) countries (excluding the United States) and 24 Emerging Markets (EM) countries. The index covers approximately 85% of the global equity opportunity set outside the U.S. An investor cannot invest directly in an index. The volatility of the benchmark may be materially different from the individual performance obtained by a specific investor.

The Russell 2000 Index is a well-known, unmanaged index of the prices of 2000 small-cap company common stocks, selected by Russell. The Russell 2000 Index assumes reinvestment of dividends but does not reflect advisory fees. An investor cannot invest directly in an index. The volatility of the benchmark may be materially different from the individual performance obtained by a specific investor.

The S&P Mid Cap 400 provides investors with a benchmark for mid-sized companies. The index, which is distinct from the large-cap S&P 500, is designed to measure the performance of 400 mid-sized companies, reflecting the distinctive risk and return characteristics of this market segment.

The S&P 500 Pure Value index is a style-concentrated index designed to track the performance of stocks that exhibit the strongest value characteristics by using a style-attractiveness-weighting scheme. An investor cannot directly invest in an index.  The volatility of the benchmark may be materially different from the individual performance obtained by a specific investor.

Mitch Zacks – Weekly Market Commentary: The 4 Risks Investors Should Worry About Most

By Weekly Market Commentary

Barring a sharp correction in the next few trading sessions, U.S. stocks are likely heading into the fourth quarter near all-time highs. I’ve made the case previously that steady, although fairly modest, economic growth paired with resilient earnings has supported prices to date. With the Federal Reserve poised to ease monetary policy as the economy expands, there is not a great case for being outright bearish.1

But that does not mean risks are low. Below, I outline four that I think investors should be keenly watching in the next quarter and beyond.

Risk #1: A Second Wave of Inflation

Among institutional investors, recession fears dominated earlier this year, particularly following the “Liberation Day” announcement. Today, it’s inflation that is again the top concern. August CPI data underscored this concern, with inflation coming in hotter-than-expected. The risk here is that the Fed will again have to reverse course, just as the market is baking in expectations for several rate cuts.

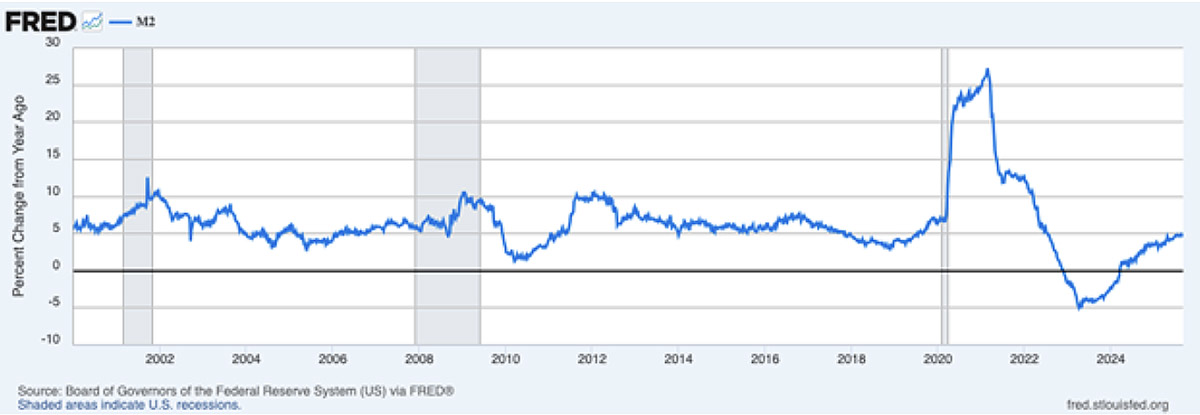
Prices for some goods may rise, especially where tariffs hit. But without the monetary backdrop to sustain a broad-based surge, the specter of runaway inflation looks overstated, in my view. Broad money supply growth in the U.S. remains tame (see M2 money supply chart below), though the trend line will be worth watching closely in the months ahead.

Source: Federal Reserve Bank of St. Louis 2

Risk #2:  Concern Over Federal Reserve Independence and U.S. Dollar Weakness

Fed policy is always political to some degree, given that appointments come from the White House and confirmations from the Senate. Removing Fed governors because of a disagreement over policy would be a major concern, but the Supreme Court already reaffirmed this year that such an act would be illegal. Public criticism of rate policy may seem threatening, but it’s also nothing new, and there is little evidence it has swayed decision-making from the Federal Open Markets Committee.

As for the dollar, “de-dollarization” chatter resurfaces regularly, with Russia, China, or the BRICS bloc often floated as challengers. Yet data show the dollar still comprises more than half of global currency reserves, and it is involved in nearly 90% of all foreign exchange transactions. No other currency matches the U.S. dollar’s liquidity, stability, and global reach. Over time, the dollar’s share may fluctuate, but fears of sudden debasement or collapse look misplaced.

Risk #3: Over-Concentration

Tech remains the market’s favorite sector, with AI-related companies driving much of 2025’s gains. In my view, this enthusiasm reflects strong fundamentals. Q3 2025 Tech earnings are expected to rise over 12% year-over-year on similarly strong revenue growth.

But with enthusiasm comes concentration. When too much capital chases the same trade, markets become vulnerable to abrupt reversals if sentiment shifts. For now, earnings support remains solid, but this is a reminder of the importance of diversification. Overcrowding isn’t a reason to avoid strong companies, but it does raise the odds of volatility if momentum cools.

Risk #4: Rising Long-Term Bond Yields
​​​​​
The summer saw 30-year yields in the U.S., U.K., France, and Germany climb to multi-year highs, sparking a wave of debt-crisis headlines. In Britain, rising gilt yields were pinned on budget concerns. In France, an offhand remark about an IMF bailout got blown out of proportion. In the U.S., some tied higher yields to worries about refunding tariffs should courts strike them down.

But a closer look reveals that rising long yields is a global issue. Italy, Spain, Canada, and Australia all saw long-term yields rise in tandem. In my view, and as I’ve written before, this trend is less about country-specific fiscal woes and more about sentiment flowing through interconnected global bond markets. Historically, modest increases in long rates alongside central bank rate cuts steepen yield curves, which is a setup that can support lending and growth.

Bottom Line for Investors

It’s a mixed bag right now for investors. Many are growing more bullish as 2025 closes, but worries also remain. Inflation, Fed independence, dollar stability, crowded trades, and rising yields all top the list. But it’s also true that these risks are widely known and widely discussed, which in my view reduces their power to derail the bull market.

For long-term investors, the persistence of these worries ultimately creates a constructive backdrop. Earnings continue to hold up, the Fed has begun easing, and the economy is chugging along despite headwinds. Volatility may flare if one of these worries dominates headlines again, or if the risk comes to fruition in a worse way than expected. That’s why I’m urging investors to stay focused on them.

TrustNet. September 16, 2025. https://advisor.zacksim.com/e/376582/ite-record-overvaluation-fears/5tmj31/1326236343/h/GiShj21LxhtbTDGNKyNnyarlFm8_dLP4EUXm8RxlG2U

Fred Economic Data. September 23, 2025. https://advisor.zacksim.com/e/376582/series-WM2NS-/5tmj34/1326236343/h/GiShj21LxhtbTDGNKyNnyarlFm8_dLP4EUXm8RxlG2U

DISCLOSURE
Past performance is no guarantee of future results. Inherent in any investment is the potential for loss.

Zacks Investment Management, Inc. is a wholly-owned subsidiary of Zacks Investment Research. Zacks Investment Management is an independent Registered Investment Advisory firm and acts as an investment manager for individuals and institutions. Zacks Investment Research is a provider of earnings data and other financial data to institutions and to individuals.

This material is being provided for informational purposes only and nothing herein constitutes investment, legal, accounting or tax advice, or a recommendation to buy, sell or hold a security. Do not act or rely upon the information and advice given in this publication without seeking the services of competent and professional legal, tax, or accounting counsel. Publication and distribution of this article is not intended to create, and the information contained herein does not constitute, an attorney-client relationship. No recommendation or advice is being given as to whether any investment or strategy is suitable for a particular investor. It should not be assumed that any investments in securities, companies, sectors or markets identified and described were or will be profitable. All information is current as of the date of herein and is subject to change without notice. Any views or opinions expressed may not reflect those of the firm as a whole.

Any projections, targets, or estimates in this report are forward looking statements and are based on the firm’s research, analysis, and assumptions. Due to rapidly changing market conditions and the complexity of investment decisions, supplemental information and other sources may be required to make informed investment decisions based on your individual investment objectives and suitability specifications. All expressions of opinions are subject to change without notice. Clients should seek financial advice regarding the appropriateness of investing in any security or investment strategy discussed in this presentation.

Certain economic and market information contained herein has been obtained from published sources prepared by other parties.  Zacks Investment Management does not assume any responsibility for the accuracy or completeness of such information. Further, no third party has assumed responsibility for independently verifying the information contained herein and accordingly no such persons make any representations with respect to the accuracy, completeness or reasonableness of the information provided herein. Unless otherwise indicated, market analysis and conclusions are based upon opinions or assumptions that Zacks Investment Management considers to be reasonable. Any investment inherently involves a high degree of risk, beyond any specific risks discussed herein.

The S&P 500 Index is a well-known, unmanaged index of the prices of 500 large-company common stocks, mainly blue-chip stocks, selected by Standard & Poor’s. The S&P 500 Index assumes reinvestment of dividends but does not reflect advisory fees. The volatility of the benchmark may be materially different from the individual performance obtained by a specific investor. An investor cannot invest directly in an index.

The Russell 1000 Growth Index is a well-known, unmanaged index of the prices of 1000 large-company growth common stocks selected by Russell. The Russell 1000 Growth Index assumes reinvestment of dividends but does not reflect advisory fees. An investor cannot invest directly in an index. The volatility of the benchmark may be materially different from the individual performance obtained by a specific investor.

Nasdaq Composite Index is the market capitalization-weighted index of over 3,300 common equities listed on the Nasdaq stock exchange. The types of securities in the index include American depositary receipts, common stocks, real estate investment trusts (REITs) and tracking stocks, as well as limited partnership interests. The index includes all Nasdaq-listed stocks that are not derivatives, preferred shares, funds, exchange-traded funds (ETFs) or debenture securities. An investor cannot invest directly in an index. The volatility of the benchmark may be materially different from the individual performance obtained by a specific investor.

The Dow Jones Industrial Average measures the daily stock market movements of 30 U.S. publicly-traded companies listed on the NASDAQ or the New York Stock Exchange (NYSE). The 30 publicly-owned companies are considered leaders in the United States economy. An investor cannot directly invest in an index.  The volatility of the benchmark may be materially different from the individual performance obtained by a specific investor.

The Bloomberg Global Aggregate Index is a flagship measure of global investment grade debt from twenty-four local currency markets. This multi-currency benchmark includes treasury, government-related, corporate and securitized fixed-rate bonds from both developed and emerging markets issuers. An investor cannot invest directly in an index. The volatility of the benchmark may be materially different from the individual performance obtained by a specific investor.

The ICE Exchange-Listed Fixed & Adjustable Rate Preferred Securities Index is a modified market capitalization weighted index composed of preferred stock and securities that are functionally equivalent to preferred stock including, but not limited to, depositary preferred securities, perpetual subordinated debt and certain securities issued by banks and other financial institutions that are eligible for capital treatment with respect to such instruments akin to that received for issuance of straight preferred stock. An investor cannot invest directly in an index. The volatility of the benchmark may be materially different from the individual performance obtained by a specific investor.

The MSCI ACWI ex U.S. Index captures large and mid-cap representation across 22 of 23 Developed Markets (DM) countries (excluding the United States) and 24 Emerging Markets (EM) countries. The index covers approximately 85% of the global equity opportunity set outside the U.S. An investor cannot invest directly in an index. The volatility of the benchmark may be materially different from the individual performance obtained by a specific investor.

The Russell 2000 Index is a well-known, unmanaged index of the prices of 2000 small-cap company common stocks, selected by Russell. The Russell 2000 Index assumes reinvestment of dividends but does not reflect advisory fees. An investor cannot invest directly in an index. The volatility of the benchmark may be materially different from the individual performance obtained by a specific investor.

The S&P Mid Cap 400 provides investors with a benchmark for mid-sized companies. The index, which is distinct from the large-cap S&P 500, is designed to measure the performance of 400 mid-sized companies, reflecting the distinctive risk and return characteristics of this market segment.

The S&P 500 Pure Value index is a style-concentrated index designed to track the performance of stocks that exhibit the strongest value characteristics by using a style-attractiveness-weighting scheme. An investor cannot directly invest in an index.  The volatility of the benchmark may be materially different from the individual performance obtained by a specific investor.