Tax planning in 2026 is poised to look a lot different than it did in 2025. With the passage of the One Big Beautiful Bill Act (OBBBA), provisions of the tax code are now either indexed, extended, or evolving in ways that could shape longer-term decisions for high-net-worth families, retirees, and business owners.
In my view, that makes the turn of the year a good moment to step back and assess the shifting landscape.
Before getting into planning considerations, it’s worth starting with a quick reset on where things stand. Income tax brackets continue to be adjusted for inflation, as do standard deduction amounts, meaning many households will see higher thresholds before moving into higher marginal brackets.
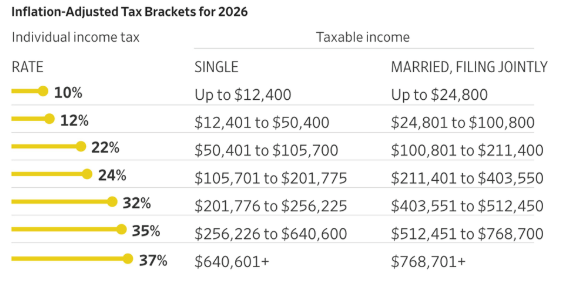
Source: The Wall Street Journal 1
The standard deduction has also risen meaningfully compared with pre-pandemic levels, reducing the number of taxpayers who itemize and changing the relative value of certain deductions.
For high-net-worth individuals, one of the most consequential developments involves estate and gifting rules. In 2026, the federal estate and gift tax exemption is scheduled to rise to $15 million per individual, or $30 million for married couples. These are historically elevated levels and materially expand the amount of wealth that can be transferred without triggering federal estate or gift taxes.
Charitable planning is also becoming more closely integrated with estate and income planning. For charitably inclined families, donor-advised funds (DAFs) are an increasingly tapped structure because of how they work. DAFs allow an individual to make a charitable contribution and receive the associated income tax deduction in the year of the contribution, while retaining flexibility over when grants are ultimately made to charities over time. Assets contributed to a DAF can remain invested.
For those still in their working years, higher contribution limits afford the opportunity to save more in 2026. Here are the max deferrals:
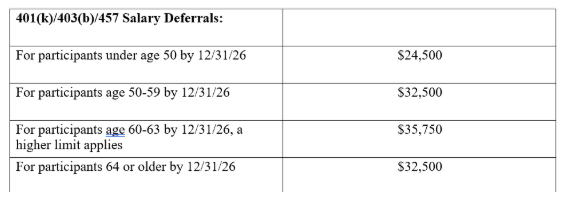
Source: Internal Revenue Service 2
High income earners also need to take note of a key change next year. Beginning in 2026, employees whose prior-year wages exceed $145,000 (indexed for inflation) will generally be required to make 401(k) catch-up contributions on a Roth basis rather than pre-tax, provided their plan offers a Roth option.
That’s a very important rule change.
This change effectively shifts tax on those catch-up dollars into the current year but allows the funds to grow and be withdrawn tax-free in retirement if the usual Roth rules are met. To note, retirement plans that do not offer Roth contributions may be unable to accept catch-up contributions for affected employees until they add that feature. For high-income earners who rely on catchups, your tax advisor can help determine whether your employer plan is prepared for this change and how to best balance pre-tax, Roth, and taxable savings given your circumstances.
Finally, small business owners also have new tax provisions to weigh. New rules affecting pass-through entities are now more durable, including the 20% qualified business income deduction. Bonus depreciation has returned to 100%, and Section 179 expense limits remain above $1 million. These provisions are best viewed as capital-allocation incentives rather than short-term tax benefits. They influence decisions around reinvestment, succession planning, and income timing, and they often overlap with personal and estate planning in ways that merit a coordinated approach.
Bottom Line for Investors
In my view, there’s plenty of unique opportunities ahead as it relates to tax planning.
Changes to brackets and deductions set the baseline, while estate exemptions, charitable structures, retirement income rules, and business incentives shape longer-term outcomes.
1 Wall Street Journal. October 9, 2025. https://advisor.zacksim.com/e/376582/ome-tax-brackets-2026-bbd1863d/5ty927/1420776786/h/f3n21rJfxeBrplA4XZ7tiuxLvzzfHlu1nFzXyeDNtaQ
2 IRS.gov. November 13, 2025. https://advisor.zacksim.com/e/376582/26-ira-limit-increases-to-7500/5ty921/1420776786/h/f3n21rJfxeBrplA4XZ7tiuxLvzzfHlu1nFzXyeDNtaQ
DISCLOSURE
Past performance is no guarantee of future results. Inherent in any investment is the potential for loss.
Zacks Investment Management, Inc. is a wholly-owned subsidiary of Zacks Investment Research. Zacks Investment Management is an independent Registered Investment Advisory firm and acts as an investment manager for individuals and institutions. Zacks Investment Research is a provider of earnings data and other financial data to institutions and to individuals.
This material is being provided for informational purposes only and nothing herein constitutes investment, legal, accounting or tax advice, or a recommendation to buy, sell or hold a security. Do not act or rely upon the information and advice given in this publication without seeking the services of competent and professional legal, tax, or accounting counsel. Publication and distribution of this article is not intended to create, and the information contained herein does not constitute, an attorney-client relationship. No recommendation or advice is being given as to whether any investment or strategy is suitable for a particular investor. It should not be assumed that any investments in securities, companies, sectors or markets identified and described were or will be profitable. All information is current as of the date of herein and is subject to change without notice. Any views or opinions expressed may not reflect those of the firm as a whole.
Any projections, targets, or estimates in this report are forward looking statements and are based on the firm’s research, analysis, and assumptions. Due to rapidly changing market conditions and the complexity of investment decisions, supplemental information and other sources may be required to make informed investment decisions based on your individual investment objectives and suitability specifications. All expressions of opinions are subject to change without notice. Clients should seek financial advice regarding the appropriateness of investing in any security or investment strategy discussed in this presentation.
Certain economic and market information contained herein has been obtained from published sources prepared by other parties. Zacks Investment Management does not assume any responsibility for the accuracy or completeness of such information. Further, no third party has assumed responsibility for independently verifying the information contained herein and accordingly no such persons make any representations with respect to the accuracy, completeness or reasonableness of the information provided herein. Unless otherwise indicated, market analysis and conclusions are based upon opinions or assumptions that Zacks Investment Management considers to be reasonable. Any investment inherently involves a high degree of risk, beyond any specific risks discussed herein.
The S&P 500 Index is a well-known, unmanaged index of the prices of 500 large-company common stocks, mainly blue-chip stocks, selected by Standard & Poor’s. The S&P 500 Index assumes reinvestment of dividends but does not reflect advisory fees. The volatility of the benchmark may be materially different from the individual performance obtained by a specific investor. An investor cannot invest directly in an index.
The Russell 1000 Growth Index is a well-known, unmanaged index of the prices of 1000 large-company growth common stocks selected by Russell. The Russell 1000 Growth Index assumes reinvestment of dividends but does not reflect advisory fees. An investor cannot invest directly in an index. The volatility of the benchmark may be materially different from the individual performance obtained by a specific investor.
Nasdaq Composite Index is the market capitalization-weighted index of over 3,300 common equities listed on the Nasdaq stock exchange. The types of securities in the index include American depositary receipts, common stocks, real estate investment trusts (REITs) and tracking stocks, as well as limited partnership interests. The index includes all Nasdaq-listed stocks that are not derivatives, preferred shares, funds, exchange-traded funds (ETFs) or debenture securities. An investor cannot invest directly in an index. The volatility of the benchmark may be materially different from the individual performance obtained by a specific investor.
The Dow Jones Industrial Average measures the daily stock market movements of 30 U.S. publicly-traded companies listed on the NASDAQ or the New York Stock Exchange (NYSE). The 30 publicly-owned companies are considered leaders in the United States economy. An investor cannot directly invest in an index. The volatility of the benchmark may be materially different from the individual performance obtained by a specific investor.
The Bloomberg Global Aggregate Index is a flagship measure of global investment grade debt from twenty-four local currency markets. This multi-currency benchmark includes treasury, government-related, corporate and securitized fixed-rate bonds from both developed and emerging markets issuers. An investor cannot invest directly in an index. The volatility of the benchmark may be materially different from the individual performance obtained by a specific investor.
The ICE Exchange-Listed Fixed & Adjustable Rate Preferred Securities Index is a modified market capitalization weighted index composed of preferred stock and securities that are functionally equivalent to preferred stock including, but not limited to, depositary preferred securities, perpetual subordinated debt and certain securities issued by banks and other financial institutions that are eligible for capital treatment with respect to such instruments akin to that received for issuance of straight preferred stock. An investor cannot invest directly in an index. The volatility of the benchmark may be materially different from the individual performance obtained by a specific investor.
The MSCI ACWI ex U.S. Index captures large and mid-cap representation across 22 of 23 Developed Markets (DM) countries (excluding the United States) and 24 Emerging Markets (EM) countries. The index covers approximately 85% of the global equity opportunity set outside the U.S. An investor cannot invest directly in an index. The volatility of the benchmark may be materially different from the individual performance obtained by a specific investor.
The Russell 2000 Index is a well-known, unmanaged index of the prices of 2000 small-cap company common stocks, selected by Russell. The Russell 2000 Index assumes reinvestment of dividends but does not reflect advisory fees. An investor cannot invest directly in an index. The volatility of the benchmark may be materially different from the individual performance obtained by a specific investor.
The S&P Mid Cap 400 provides investors with a benchmark for mid-sized companies. The index, which is distinct from the large-cap S&P 500, is designed to measure the performance of 400 mid-sized companies, reflecting the distinctive risk and return characteristics of this market segment.
The S&P 500 Pure Value index is a style-concentrated index designed to track the performance of stocks that exhibit the strongest value characteristics by using a style-attractiveness-weighting scheme. An investor cannot directly invest in an index. The volatility of the benchmark may be materially different from the individual performance obtained by a specific investor.