Monthly Archives

March 2026

Mitch Zacks – Weekly Market Commentary: Market Volatility Doesn’t Always Signal Economic Weakness

By Weekly Market Commentary

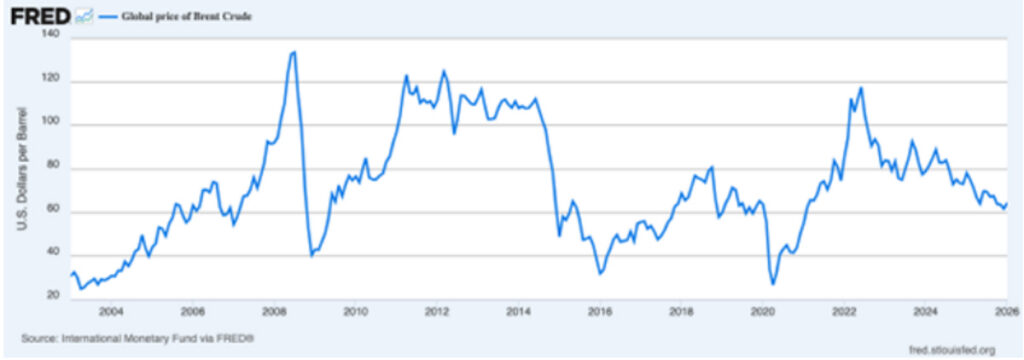
Market volatility has been on the rise. The conflict involving Iran has injected fresh uncertainty into the outlook, particularly through its potential impact on energy markets. And just as quickly as oil spiked and stocks wobbled on fears of escalation, markets reversed course early this week after reports of possible diplomatic progress—sending Brent crude sharply lower and stocks higher.1

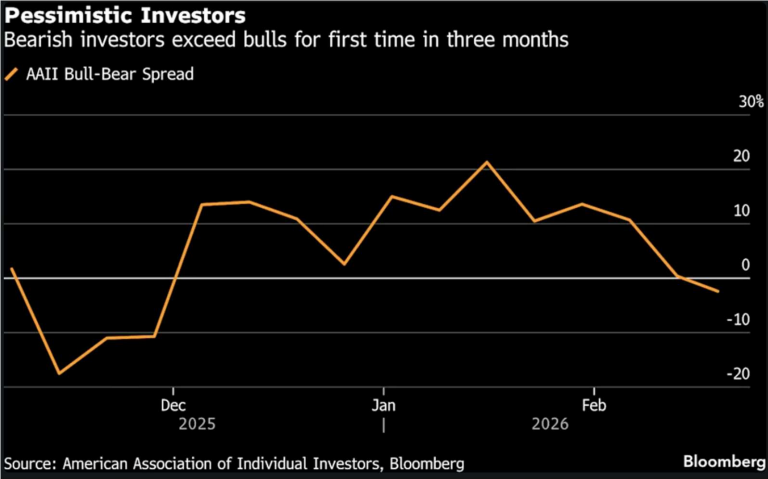
This kind of day-by-day price action is a useful reminder that headlines can move markets in the short run. But investors should be careful not to confuse short-term volatility with a lasting change in the underlying economic picture. The more important question is whether higher energy prices are actually beginning to damage growth. So far, the incoming data do not suggest that they are.

Start with the most visible pain point for households: gasoline. Higher prices at the pump are frustrating, and they can weigh on sentiment quickly. But gasoline represents just 1.9% of real personal consumption expenditures. That does not mean rising prices are painless, but it does mean their direct effect on overall consumer spending is more limited than headlines often imply. Consumers may shift spending at the margin, but a jump in gasoline prices alone is not usually enough to derail aggregate demand.

And demand elsewhere still looks intact. Real personal consumption expenditures rose 0.4% month over month in January, while real disposable personal income also increased. In services, which make up the largest share of the economy, activity remains firmly in expansion territory. The ISM Services PMI registered 56.1 in February, the highest reading in four years. The Atlanta Fed’s GDPNow estimate is tracking first-quarter growth at 2.7% annualized.

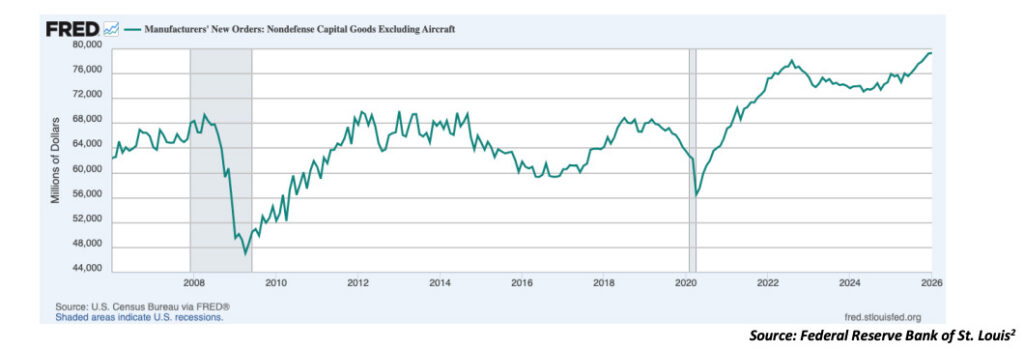
Business investment data tell a similar story. Manufacturers’ new orders for nondefense capital goods excluding aircraft (which is one of the cleaner indicators of business equipment demand) remain near recent highs. That is not what an economy on the verge of contraction typically looks like.

The earnings picture is also important here because corporate profits ultimately drive equity markets over time. According to our colleagues at Zacks Investment Research, total S&P 500 earnings for the first quarter of 2026 are expected to rise 12.0% from a year earlier on 8.6% higher revenues, following a 14% earnings increase on 9.1% higher revenues in the prior quarter. Even after the onset of Middle East tensions, estimates for the quarter and for full-year 2026 have remained positive, with revisions still moving in a favorable direction.

It is also worth remembering how different the market’s earnings mix is today than in past oil-shock periods. Energy now accounts for only about 4% of S&P 500 earnings, down from roughly 15% twenty years ago and nearly 30% in 1980. Technology, by contrast, is expected to grow earnings by 24.6% in the first quarter and remains the dominant growth engine for the index. Even excluding Technology, the rest of the S&P 500 is still expected to grow earnings by 5.5%.

I don’t mean to firmly imply that the economy is immune to an energy shock. If oil prices were to rise sharply and remain elevated—in my view, perhaps $130+ per barrel for several months—the impact on inflation and growth would likely become more pronounced. I’m not convinced that’s an outcome that the U.S. or other developed countries would tolerate for very long, but it’s also fair to say that these events are difficult to forecast.

Even still, the current backdrop looks materially different from the periods investors instinctively compare it to. The U.S. economy is less energy-intensive than it was in the 1970s. Domestic oil production is much higher, the labor market is largely stable, and balance sheets (household, corporate, and banking) are generally in strong shape.

Across major geopolitical events since 1950, markets have often experienced short-term volatility, but they have generally stabilized and moved higher in the months that followed as uncertainty faded and the economic damage proved more limited than feared. That does not make conflict bullish. It simply underscores that markets tend to respond more to the gap between expectations and reality than to the headlines themselves.

Bottom Line for Investors

Geopolitical events can create sharp market swings, especially when oil prices are involved. But volatility alone is not evidence of economic weakness. The latest data continue to show consumer demand, business investment, and earnings growth holding up reasonably well, even as energy markets react to the latest headlines.

If oil prices were to spike sharply from here and remain elevated for a sustained period, the risk would increase. But that is not the same as saying the economy is already rolling over. For now, the better reading is that markets are reacting to uncertainty while the underlying economic picture remains more resilient than the headlines suggest.

The Street. March 23, 2026. https://advisor.zacksim.com/e/376582/ence-despite-rising-oil-prices/5v91yf/1496855850/h/v9QiexteW5YTOmM9SOxAg4R8mQrjmrTvdKKCBG2jF6s

Fred Economic Data. March 18, 2026. https://advisor.zacksim.com/e/376582/series-DGORDER/5v91yj/1496855850/h/v9QiexteW5YTOmM9SOxAg4R8mQrjmrTvdKKCBG2jF6s

DISCLOSURE
Past performance is no guarantee of future results. Inherent in any investment is the potential for loss.

Zacks Investment Management, Inc. is a wholly-owned subsidiary of Zacks Investment Research. Zacks Investment Management is an independent Registered Investment Advisory firm and acts as an investment manager for individuals and institutions. Zacks Investment Research is a provider of earnings data and other financial data to institutions and to individuals.

This material is being provided for informational purposes only and nothing herein constitutes investment, legal, accounting or tax advice, or a recommendation to buy, sell or hold a security. Do not act or rely upon the information and advice given in this publication without seeking the services of competent and professional legal, tax, or accounting counsel. Publication and distribution of this article is not intended to create, and the information contained herein does not constitute, an attorney-client relationship. No recommendation or advice is being given as to whether any investment or strategy is suitable for a particular investor. It should not be assumed that any investments in securities, companies, sectors or markets identified and described were or will be profitable. All information is current as of the date of herein and is subject to change without notice. Any views or opinions expressed may not reflect those of the firm as a whole.

Any projections, targets, or estimates in this report are forward looking statements and are based on the firm’s research, analysis, and assumptions. Due to rapidly changing market conditions and the complexity of investment decisions, supplemental information and other sources may be required to make informed investment decisions based on your individual investment objectives and suitability specifications. All expressions of opinions are subject to change without notice. Clients should seek financial advice regarding the appropriateness of investing in any security or investment strategy discussed in this presentation.

Certain economic and market information contained herein has been obtained from published sources prepared by other parties.  Zacks Investment Management does not assume any responsibility for the accuracy or completeness of such information. Further, no third party has assumed responsibility for independently verifying the information contained herein and accordingly no such persons make any representations with respect to the accuracy, completeness or reasonableness of the information provided herein. Unless otherwise indicated, market analysis and conclusions are based upon opinions or assumptions that Zacks Investment Management considers to be reasonable. Any investment inherently involves a high degree of risk, beyond any specific risks discussed herein.

The S&P 500 Index is a well-known, unmanaged index of the prices of 500 large-company common stocks, mainly blue-chip stocks, selected by Standard & Poor’s. The S&P 500 Index assumes reinvestment of dividends but does not reflect advisory fees. The volatility of the benchmark may be materially different from the individual performance obtained by a specific investor. An investor cannot invest directly in an index. 

The Russell 1000 Growth Index is a well-known, unmanaged index of the prices of 1000 large-company growth common stocks selected by Russell. The Russell 1000 Growth Index assumes reinvestment of dividends but does not reflect advisory fees. An investor cannot invest directly in an index. The volatility of the benchmark may be materially different from the individual performance obtained by a specific investor.

Nasdaq Composite Index is the market capitalization-weighted index of over 3,300 common equities listed on the Nasdaq stock exchange. The types of securities in the index include American depositary receipts, common stocks, real estate investment trusts (REITs) and tracking stocks, as well as limited partnership interests. The index includes all Nasdaq-listed stocks that are not derivatives, preferred shares, funds, exchange-traded funds (ETFs) or debenture securities. An investor cannot invest directly in an index. The volatility of the benchmark may be materially different from the individual performance obtained by a specific investor.

The Dow Jones Industrial Average measures the daily stock market movements of 30 U.S. publicly-traded companies listed on the NASDAQ or the New York Stock Exchange (NYSE). The 30 publicly-owned companies are considered leaders in the United States economy. An investor cannot directly invest in an index.  The volatility of the benchmark may be materially different from the individual performance obtained by a specific investor.

The Bloomberg Global Aggregate Index is a flagship measure of global investment grade debt from twenty-four local currency markets. This multi-currency benchmark includes treasury, government-related, corporate and securitized fixed-rate bonds from both developed and emerging markets issuers. An investor cannot invest directly in an index. The volatility of the benchmark may be materially different from the individual performance obtained by a specific investor.

The ICE Exchange-Listed Fixed & Adjustable Rate Preferred Securities Index is a modified market capitalization weighted index composed of preferred stock and securities that are functionally equivalent to preferred stock including, but not limited to, depositary preferred securities, perpetual subordinated debt and certain securities issued by banks and other financial institutions that are eligible for capital treatment with respect to such instruments akin to that received for issuance of straight preferred stock. An investor cannot invest directly in an index. The volatility of the benchmark may be materially different from the individual performance obtained by a specific investor.

The MSCI ACWI ex U.S. Index captures large and mid-cap representation across 22 of 23 Developed Markets (DM) countries (excluding the United States) and 24 Emerging Markets (EM) countries. The index covers approximately 85% of the global equity opportunity set outside the U.S. An investor cannot invest directly in an index. The volatility of the benchmark may be materially different from the individual performance obtained by a specific investor.

The Russell 2000 Index is a well-known, unmanaged index of the prices of 2000 small-cap company common stocks, selected by Russell. The Russell 2000 Index assumes reinvestment of dividends but does not reflect advisory fees. An investor cannot invest directly in an index. The volatility of the benchmark may be materially different from the individual performance obtained by a specific investor.

The S&P Mid Cap 400 provides investors with a benchmark for mid-sized companies. The index, which is distinct from the large-cap S&P 500, is designed to measure the performance of 400 mid-sized companies, reflecting the distinctive risk and return characteristics of this market segment.

The S&P 500 Pure Value index is a style-concentrated index designed to track the performance of stocks that exhibit the strongest value characteristics by using a style-attractiveness-weighting scheme. An investor cannot directly invest in an index.  The volatility of the benchmark may be materially different from the individual performance obtained by a specific investor.

Mitch Zacks – Weekly Market Commentary: What the Private Credit Boom is Revealing

By Weekly Market Commentary

For the past several weeks, investors have understandably focused on developments in the Middle East. The headlines are constant, and markets often exhibit elevated volatility with every new development.

But investors should not lose sight of other important developments taking shape across capital markets. Private credit is one area worth a closer look, in my view.

For readers who may be new to private credit, it is a segment of the market where investment funds provide loans rather than traditional banks. The industry expanded rapidly after the Global Financial Crisis, when tighter banking regulations limited how aggressively traditional lenders could finance riskier borrowers. Capital moved to nonbank lenders such as asset managers, pension funds, and private investment firms that stepped in to fill the gap.1

Stronger rules made banks safer, but more lending activity shifted into institutions operating outside the traditional regulatory framework. The risks in the financial system did not disappear with this change, they just shifted.

One area drawing attention today is redemption pressure in funds that market themselves as semi-liquid vehicles. The $33 billion Cliffwater Corporate Lending Fund, for instance, recently reported that investors asked to withdraw roughly 14% of the fund’s assets in a single quarter. Because the fund limits withdrawals to 5%, it agreed to repurchase only about half of those requests, with the remainder pushed into future redemption windows.

Similar pressures have appeared elsewhere across the industry. Blackstone’s $82 billion credit fund recently reported net withdrawals for the first time, while firms including Blue Owl, BlackRock, and Morgan Stanley have limited investor withdrawals to preset quarterly caps. These limits are not unusual in private markets, but when investors want their money back, those limits can become far more noticeable.

Valuation practices are also drawing new scrutiny.

Private-credit portfolios can contain thousands of loans and investments that do not trade publicly, meaning their values must be estimated using models and assumptions rather than observable market prices. Cliffwater’s filings show that roughly 71% of its assets are classified as “Level 3,” meaning their valuations rely heavily on unobservable inputs. The fund also invests billions of dollars in other private-credit vehicles and relies on those managers’ reported net asset values, rather than independently determining prices. That’s a slippery slope, in my view.

The result can resemble what one observer described as a financial system of “black boxes inside black boxes,”2 where investors rely on layers of valuation judgments that are difficult to independently verify. In stable periods, this structure rarely attracts much attention. But when investors begin questioning valuations, the lack of visibility can suddenly matter a great deal.

The issues I’m describing above land at a time when the industry is becoming increasingly reliant on individual investors. Until recently, private credit was historically dominated by pensions, endowments, and other institutions with long investment horizons. But in recent years, asset managers have increasingly marketed these strategies directly to individuals through interval funds, wealth platforms, and specialized vehicles. Policymakers in Washington are also considering steps that could make it easier for retirement plans to include private investments.

Large firms such as Apollo Global Management, Blackstone, BlackRock, and Blue Owl have made retail distribution central to their growth strategies. For these firms, such a strategy makes good business sense—retail savings pools, including the $12 trillion 401(k) market, represent a vast potential source of capital. The question is whether these strategies make sense for most everyday investors.

Private-market investments typically involve higher fees, less transparency, and more limited liquidity than traditional public securities. For individual investors, the main issue is that these funds often do not work like the rest of a traditional portfolio. Shares may only be redeemable at certain intervals, withdrawals can be capped when demand is high, and reported values may not adjust as quickly as public market prices. That can make these strategies appear steadier on paper, while leaving investors with less flexibility and a murkier picture of risk in real time. Which for many, is the opposite of what you’re seeking in today’s geopolitical environment.

Bottom Line for Investors

To be fair, I do not think we have an impending crisis on our hands, at least not at this stage. Many private-credit loans continue to perform, and recent stresses appear concentrated rather than systemic. But it is still a story worth watching, because moments like this reveal how these structures behave when sentiment shifts—particularly with respect to liquidity, valuation, and investor expectations.

Wall Street Journal. March 12, 2026. https://advisor.zacksim.com/e/376582/-private-credit-craze-d0fbb8af/5v89tw/1489468160/h/bt-JCfBLTQvvBhTkEVYLJphQywjni31WsEN892p2mHE

Wall Street Journal. March 12, 2026. https://advisor.zacksim.com/e/376582/-private-credit-craze-d0fbb8af/5v89tw/1489468160/h/bt-JCfBLTQvvBhTkEVYLJphQywjni31WsEN892p2mHE

DISCLOSURE
Past performance is no guarantee of future results. Inherent in any investment is the potential for loss.

Zacks Investment Management, Inc. is a wholly-owned subsidiary of Zacks Investment Research. Zacks Investment Management is an independent Registered Investment Advisory firm and acts as an investment manager for individuals and institutions. Zacks Investment Research is a provider of earnings data and other financial data to institutions and to individuals.

This material is being provided for informational purposes only and nothing herein constitutes investment, legal, accounting or tax advice, or a recommendation to buy, sell or hold a security. Do not act or rely upon the information and advice given in this publication without seeking the services of competent and professional legal, tax, or accounting counsel. Publication and distribution of this article is not intended to create, and the information contained herein does not constitute, an attorney-client relationship. No recommendation or advice is being given as to whether any investment or strategy is suitable for a particular investor. It should not be assumed that any investments in securities, companies, sectors or markets identified and described were or will be profitable. All information is current as of the date of herein and is subject to change without notice. Any views or opinions expressed may not reflect those of the firm as a whole.

Any projections, targets, or estimates in this report are forward looking statements and are based on the firm’s research, analysis, and assumptions. Due to rapidly changing market conditions and the complexity of investment decisions, supplemental information and other sources may be required to make informed investment decisions based on your individual investment objectives and suitability specifications. All expressions of opinions are subject to change without notice. Clients should seek financial advice regarding the appropriateness of investing in any security or investment strategy discussed in this presentation.

Certain economic and market information contained herein has been obtained from published sources prepared by other parties.  Zacks Investment Management does not assume any responsibility for the accuracy or completeness of such information. Further, no third party has assumed responsibility for independently verifying the information contained herein and accordingly no such persons make any representations with respect to the accuracy, completeness or reasonableness of the information provided herein. Unless otherwise indicated, market analysis and conclusions are based upon opinions or assumptions that Zacks Investment Management considers to be reasonable. Any investment inherently involves a high degree of risk, beyond any specific risks discussed herein.

The S&P 500 Index is a well-known, unmanaged index of the prices of 500 large-company common stocks, mainly blue-chip stocks, selected by Standard & Poor’s. The S&P 500 Index assumes reinvestment of dividends but does not reflect advisory fees. The volatility of the benchmark may be materially different from the individual performance obtained by a specific investor. An investor cannot invest directly in an index. 

The Russell 1000 Growth Index is a well-known, unmanaged index of the prices of 1000 large-company growth common stocks selected by Russell. The Russell 1000 Growth Index assumes reinvestment of dividends but does not reflect advisory fees. An investor cannot invest directly in an index. The volatility of the benchmark may be materially different from the individual performance obtained by a specific investor.

Nasdaq Composite Index is the market capitalization-weighted index of over 3,300 common equities listed on the Nasdaq stock exchange. The types of securities in the index include American depositary receipts, common stocks, real estate investment trusts (REITs) and tracking stocks, as well as limited partnership interests. The index includes all Nasdaq-listed stocks that are not derivatives, preferred shares, funds, exchange-traded funds (ETFs) or debenture securities. An investor cannot invest directly in an index. The volatility of the benchmark may be materially different from the individual performance obtained by a specific investor.

The Dow Jones Industrial Average measures the daily stock market movements of 30 U.S. publicly-traded companies listed on the NASDAQ or the New York Stock Exchange (NYSE). The 30 publicly-owned companies are considered leaders in the United States economy. An investor cannot directly invest in an index.  The volatility of the benchmark may be materially different from the individual performance obtained by a specific investor.

The Bloomberg Global Aggregate Index is a flagship measure of global investment grade debt from twenty-four local currency markets. This multi-currency benchmark includes treasury, government-related, corporate and securitized fixed-rate bonds from both developed and emerging markets issuers. An investor cannot invest directly in an index. The volatility of the benchmark may be materially different from the individual performance obtained by a specific investor.

The ICE Exchange-Listed Fixed & Adjustable Rate Preferred Securities Index is a modified market capitalization weighted index composed of preferred stock and securities that are functionally equivalent to preferred stock including, but not limited to, depositary preferred securities, perpetual subordinated debt and certain securities issued by banks and other financial institutions that are eligible for capital treatment with respect to such instruments akin to that received for issuance of straight preferred stock. An investor cannot invest directly in an index. The volatility of the benchmark may be materially different from the individual performance obtained by a specific investor.

The MSCI ACWI ex U.S. Index captures large and mid-cap representation across 22 of 23 Developed Markets (DM) countries (excluding the United States) and 24 Emerging Markets (EM) countries. The index covers approximately 85% of the global equity opportunity set outside the U.S. An investor cannot invest directly in an index. The volatility of the benchmark may be materially different from the individual performance obtained by a specific investor.

The Russell 2000 Index is a well-known, unmanaged index of the prices of 2000 small-cap company common stocks, selected by Russell. The Russell 2000 Index assumes reinvestment of dividends but does not reflect advisory fees. An investor cannot invest directly in an index. The volatility of the benchmark may be materially different from the individual performance obtained by a specific investor.

The S&P Mid Cap 400 provides investors with a benchmark for mid-sized companies. The index, which is distinct from the large-cap S&P 500, is designed to measure the performance of 400 mid-sized companies, reflecting the distinctive risk and return characteristics of this market segment.

The S&P 500 Pure Value index is a style-concentrated index designed to track the performance of stocks that exhibit the strongest value characteristics by using a style-attractiveness-weighting scheme. An investor cannot directly invest in an index.  The volatility of the benchmark may be materially different from the individual performance obtained by a specific investor.

Wealth Preservation Through Generations

By Financial Planning

In today’s evolving economic and regulatory environment, preserving wealth requires integrated planning that aligns tax strategy, asset protection, and intentional generational transfer. Families who plan proactively position themselves not only to protect wealth, but to sustain opportunity and stability for future generations.

Beyond Estate Planning

Preserving wealth is a continuous process, not a single event. Historically, wealth transfer focused primarily on wills and basic trust structures implemented later in life. While these tools remain important, modern planning emphasizes ongoing strategy rather than one-time documents.

Strategic wealth planning considers how assets grow, how they are taxed during a lifetime, and how efficiently they transition between generations. Research consistently shows that families who sustain wealth treat planning as an evolving system that integrates investments, governance, education, and tax efficiency rather than relying solely on traditional inheritance mechanics.

Shifting tax policies, market volatility, and regulatory complexity make proactive planning increasingly important. Waiting until retirement or late in life to structure wealth transfers can expose families to unnecessary taxation and operational risk.

Tax-Aware Wealth Structuring

When people think about growing wealth, the focus is often on investment performance, such as choosing the right assets, timing markets, or maximizing returns. But those focused on long-term wealth preservation understand that what truly matters is what remains after taxes.

Taxes can gradually reduce long-term growth if planning only happens at the end of life, which is why tax considerations are often integrated into ongoing financial planning rather than limited to estate planning alone. Planning early allows families to structure assets more intentionally, potentially moving future appreciation outside taxable estates while maintaining flexibility as needs and regulations change. Approaches such as lifetime gifting, trust planning, or charitable giving can help improve transfer performance over time. Remember, the goal is not tax avoidance, but tax efficiency aligned with long-term objectives.

Asset Protection and Governance

Preserving wealth involves more than navigating markets. Business risk, unexpected life events, and economic downturns can quickly affect wealth when assets are not carefully structured. Families who successfully maintain wealth across generations often pair legal protections with governance practices, such as investment policies, structured decision-making processes, and routine financial reviews.

These practices help ensure everyone is on the same page and that assets remain aligned with both current needs and long-term goals. At the end of the day, trust, communication, and structure help turn wealth into a long-term plan rather than a collection of investments.

Intentional Generational Transfer

The point isn’t to just transfer money, it’s about preparing those who will inherit it. Studies on generational wealth consistently show that financial capital alone does not sustain legacy. Education, experience, and values matter just as much. Financial literacy, shared family values, and gradual involvement in decision-making help future generations develop stewardship rather than dependency.

Many families gradually involve younger generations in financial decisions instead of waiting for a single inheritance event. This might include open conversations about finances, mentorship, or smaller transfers over time that allow heirs to gain experience managing wealth. Helping the next generation understand both the benefits and responsibilities of wealth will strengthen the chances that their legacy will endure.

The Role of a Financial Advisor in Generational Planning

Preparing the future generation doesn’t happen overnight, which is why many families build long-term relationships with financial advisors, tax professionals, and estate planning attorneys. Over time, these professionals can help provide consistency and guidance as wealth transitions from one generation to the next.

If you’re interested in helping lift up future generations and giving deeper purpose to the assets you’ve spent a lifetime building, don’t wait to start having these conversations. Contact BayTrust Financial today to take the first step toward building a lasting legacy.


This article is intended for informational purposes only and should not be considered tax, legal, or investment advice.

Sources:

https://www.fidelity.com/learning-center/wealth-management-insights/creating-generational-wealth

https://www.forbes.com/sites/robertdaugherty/2025/06/25/how-wealthy-families-build-and-preserve-generational-wealth/

https://www.ardentrust.com/insights/preserve-generational-wealth

https://www.investopedia.com/how-to-build-generational-wealth-8417999

https://www.privatebank.citibank.com/newcpb-media/media/documents/folp/A-Guide-to-Sustaining-Family-Wealth-Across-Multiple-Generations_CEP.pdf

https://www.advisorpedia.com/investor/how-to-build-and-protect-multi-generational-wealth-the-3-pillars-of-lasting-legacy/

Mitch Zacks – Weekly Market Commentary: Why Rising Pessimism May Ultimately Be Good for Stocks

By Weekly Market Commentary

Uncertainty is running high at the moment, and it’s making investors more skittish about economic growth and the direction of markets.

I think that’s a good thing.

Investors are not wrong to be cautious. The war in Iran has pushed oil prices sharply higher and raised fresh questions about inflation. Software stocks have stumbled as investors reassess just how much future growth is already priced in. And the latest jobs data raised a few eyebrows, as U.S. nonfarm payrolls fell by 92,000 in February and the unemployment rate ticked up to 4.4%. All told, job growth has averaged just 6,000 over the past three months.

Taken together, this confluence of events has unsurprisingly resulted in rising pessimism. As seen in the chart below, bears now outnumber bulls for the first time in several months, while other measures show professional equity positioning has turned more defensive. On its face, this may seem like bad news.

Source: Yahoo Finance1

But markets have proven to us time and again that they rarely rise in an atmosphere of total comfort. More often, markets move higher while investors remain skeptical and quick to focus on what could go wrong next. And in my view, that best describes the current environment.

Expectations have dropped quickly amid the flood of war headlines, meaning markets may not need especially good news to react positively. Markets only need outcomes that are less severe than investors currently fear. This is why any time you see a hint that the war may end soon, or that shipping through the Strait of Hormuz is expected to resume, oil prices plummet and stocks rally.

To be fair, we saw the flip side of that dynamic this week when the International Energy Agency (IEA) announced a record 400-million-barrel emergency release from strategic reserves, with several tankers in the Strait coming under attack the following day.  Even though the IEA was adding supply, both moves were interpreted as signs that supply disruptions may be more serious and longer-lasting than previously hoped. But this reaction just gives me more conviction that investors are trading on sentiment, with consensus essentially trying to predict how bad it might get, instead of pricing based on known fundamentals and a longer-term view.

A fundamental trade in the current environment would be long, in my view. The U.S. services sector (as measured by the ISM services index) rose to 56.1 in February, its highest reading since mid-2022. New orders climbed to 58.6, 14 of 18 service industries reported growth, and export orders also improved. These numbers suggest business activity is still expanding fairly broadly.

Credit trends also look very strong. Across the developed world, loan growth is accelerating, with banks in the U.S., U.K., Eurozone, and Japan lending at the fastest pace seen in several years. I think this trend could hold for some time, given that yield curves across major developed markets are upward sloping. Banks can borrow at lower short-term rates and lend at higher long-term rates with attractive spreads. In the U.S., companies are also finding ample financing in bond markets, with investment-grade issuance topping $208 billion in January, one of the few times monthly borrowing has ever exceeded $200 billion.

To be fair, the biggest risk investors are focused on is still Iran. Namely, that the war drags on, the Strait of Hormuz stays disrupted and/or closed, and oil prices remain elevated longer than expected. This outcome would surely be impactful, as higher energy prices can pressure household budgets, push up headline inflation, and complicate the growth outlook. But it is also worth keeping the consumer impact in perspective. Gasoline is highly visible, but it makes up only about 2.9% of the CPI basket. That’s not large enough on its own to dictate the direction of the economy or stock market.

The U.S. economy is also far less vulnerable to oil shocks than it used to be. Americans consumed about 4% less gasoline in 2025 than in 2007, even as real GDP was roughly 42% larger. Energy’s share of household consumption has fallen from 5.7% to 3.7% over that span, and the shale boom has turned the U.S. into a net petroleum exporter. So while higher oil prices can still pinch consumers, they also support producers and investment in ways that were far less true in past oil shocks. I don’t mean to suggest oil can’t or won’t become a bigger problem. But I think it is fair to rule out a replay of the 1970s energy crisis and bear market, even if oil pushes past $100 and this conflict draws out for a few more weeks.

Bottom Line for Investors

Investors have good reason to stay alert. The war in Iran, higher oil prices, weakness in some high-flying stocks, and softer jobs data have all added to uncertainty, and as long as those crosscurrents remain in place, short-term volatility is likely to continue. Markets may stay choppy as investors react to each new headline on oil, shipping, inflation, and the broader growth outlook.

But short-term volatility and medium-term market direction are not the same thing. Markets rarely need a calm, comfortable backdrop to move higher. In fact, some of the strongest advances occur when expectations are subdued, optimism is limited, and investors are constantly bracing for bad news. And that is what today’s setup looks like to me. ​​

Yahoo Finance. February 24, 2026. https://advisor.zacksim.com/e/376582/bulls-see-signs-103000380-html/5v7lpv/1483946041/h/fUM0JsMbInlW2EsTEt9ED1UOKnLSp1nkkgrhrvRRYaI

DISCLOSURE
Past performance is no guarantee of future results. Inherent in any investment is the potential for loss.

Zacks Investment Management, Inc. is a wholly-owned subsidiary of Zacks Investment Research. Zacks Investment Management is an independent Registered Investment Advisory firm and acts as an investment manager for individuals and institutions. Zacks Investment Research is a provider of earnings data and other financial data to institutions and to individuals.

This material is being provided for informational purposes only and nothing herein constitutes investment, legal, accounting or tax advice, or a recommendation to buy, sell or hold a security. Do not act or rely upon the information and advice given in this publication without seeking the services of competent and professional legal, tax, or accounting counsel. Publication and distribution of this article is not intended to create, and the information contained herein does not constitute, an attorney-client relationship. No recommendation or advice is being given as to whether any investment or strategy is suitable for a particular investor. It should not be assumed that any investments in securities, companies, sectors or markets identified and described were or will be profitable. All information is current as of the date of herein and is subject to change without notice. Any views or opinions expressed may not reflect those of the firm as a whole.

Any projections, targets, or estimates in this report are forward looking statements and are based on the firm’s research, analysis, and assumptions. Due to rapidly changing market conditions and the complexity of investment decisions, supplemental information and other sources may be required to make informed investment decisions based on your individual investment objectives and suitability specifications. All expressions of opinions are subject to change without notice. Clients should seek financial advice regarding the appropriateness of investing in any security or investment strategy discussed in this presentation.

Certain economic and market information contained herein has been obtained from published sources prepared by other parties.  Zacks Investment Management does not assume any responsibility for the accuracy or completeness of such information. Further, no third party has assumed responsibility for independently verifying the information contained herein and accordingly no such persons make any representations with respect to the accuracy, completeness or reasonableness of the information provided herein. Unless otherwise indicated, market analysis and conclusions are based upon opinions or assumptions that Zacks Investment Management considers to be reasonable. Any investment inherently involves a high degree of risk, beyond any specific risks discussed herein.

The S&P 500 Index is a well-known, unmanaged index of the prices of 500 large-company common stocks, mainly blue-chip stocks, selected by Standard & Poor’s. The S&P 500 Index assumes reinvestment of dividends but does not reflect advisory fees. The volatility of the benchmark may be materially different from the individual performance obtained by a specific investor. An investor cannot invest directly in an index. 

The Russell 1000 Growth Index is a well-known, unmanaged index of the prices of 1000 large-company growth common stocks selected by Russell. The Russell 1000 Growth Index assumes reinvestment of dividends but does not reflect advisory fees. An investor cannot invest directly in an index. The volatility of the benchmark may be materially different from the individual performance obtained by a specific investor.

Nasdaq Composite Index is the market capitalization-weighted index of over 3,300 common equities listed on the Nasdaq stock exchange. The types of securities in the index include American depositary receipts, common stocks, real estate investment trusts (REITs) and tracking stocks, as well as limited partnership interests. The index includes all Nasdaq-listed stocks that are not derivatives, preferred shares, funds, exchange-traded funds (ETFs) or debenture securities. An investor cannot invest directly in an index. The volatility of the benchmark may be materially different from the individual performance obtained by a specific investor.

The Dow Jones Industrial Average measures the daily stock market movements of 30 U.S. publicly-traded companies listed on the NASDAQ or the New York Stock Exchange (NYSE). The 30 publicly-owned companies are considered leaders in the United States economy. An investor cannot directly invest in an index.  The volatility of the benchmark may be materially different from the individual performance obtained by a specific investor.

The Bloomberg Global Aggregate Index is a flagship measure of global investment grade debt from twenty-four local currency markets. This multi-currency benchmark includes treasury, government-related, corporate and securitized fixed-rate bonds from both developed and emerging markets issuers. An investor cannot invest directly in an index. The volatility of the benchmark may be materially different from the individual performance obtained by a specific investor.

The ICE Exchange-Listed Fixed & Adjustable Rate Preferred Securities Index is a modified market capitalization weighted index composed of preferred stock and securities that are functionally equivalent to preferred stock including, but not limited to, depositary preferred securities, perpetual subordinated debt and certain securities issued by banks and other financial institutions that are eligible for capital treatment with respect to such instruments akin to that received for issuance of straight preferred stock. An investor cannot invest directly in an index. The volatility of the benchmark may be materially different from the individual performance obtained by a specific investor.

The MSCI ACWI ex U.S. Index captures large and mid-cap representation across 22 of 23 Developed Markets (DM) countries (excluding the United States) and 24 Emerging Markets (EM) countries. The index covers approximately 85% of the global equity opportunity set outside the U.S. An investor cannot invest directly in an index. The volatility of the benchmark may be materially different from the individual performance obtained by a specific investor.

The Russell 2000 Index is a well-known, unmanaged index of the prices of 2000 small-cap company common stocks, selected by Russell. The Russell 2000 Index assumes reinvestment of dividends but does not reflect advisory fees. An investor cannot invest directly in an index. The volatility of the benchmark may be materially different from the individual performance obtained by a specific investor.

The S&P Mid Cap 400 provides investors with a benchmark for mid-sized companies. The index, which is distinct from the large-cap S&P 500, is designed to measure the performance of 400 mid-sized companies, reflecting the distinctive risk and return characteristics of this market segment.

The S&P 500 Pure Value index is a style-concentrated index designed to track the performance of stocks that exhibit the strongest value characteristics by using a style-attractiveness-weighting scheme. An investor cannot directly invest in an index.  The volatility of the benchmark may be materially different from the individual performance obtained by a specific investor.

Copyright © 2026. All rights reserved.

Mitch Zacks – Weekly Market Commentary: Markets Do Not Panic Over Every Conflict—Investors Shouldn’t Either

By Weekly Market Commentary

The headlines coming out of the Middle East this week are unsettling. Investors are undoubtedly wondering how ongoing military strikes, retaliatory attacks, threats of wider escalation, and shocks to energy markets could impact the global economy. These are all valid concerns, and I empathize with the uncertainty many readers are likely experiencing.

But when we step back and analyze events strictly through a market lens—which is our job here at Zacks—history shows something important: regional conflicts rarely alter the long-term trajectory of global markets, unless they materially disrupt global economic activity.1

As ever, history is the most useful guide we have in these situations. Over the last 75+ years, there is ample evidence to show that regional wars and geopolitical flare-ups have no consistent relationship with recessions or prolonged bear markets. Markets often experience short-term volatility in the run-up to and immediate aftermath of conflict, which investors should expect to see in the coming days and weeks.

But once markets assess the scope and economic reach of the conflict, equities tend to refocus on fundamentals.

Indeed, in modern market history, only World War II independently caused a sustained bear market by materially impairing a significant portion of global productive capacity. More recent conflicts—including the Iraq wars, the Bosnian War, the Gulf War, the Syrian civil war, and the recent Gaza War—produced volatility, but markets ultimately moved on once the economic transmission channels became clearer. One exception may be the Russia-Ukraine war, but that conflict collided with a post-Covid supply chain crisis, soaring inflation, and rapidly rising interest rates. We’re not seeing those types of conditions today.

In the current situation, perhaps the biggest investor focus is on energy markets. Oil is the most immediate economic variable, since roughly 20 million barrels per day (about 20% of global oil production) move through the Strait of Hormuz. To be fair, a meaningful or prolonged disruption there would have implications for inflation, corporate margins, and consumer spending. It’s a factor to watch.

Brent crude prices are on the rise (chart below), but as I write, prices remain well within the range seen over the past several years. Remember, from 2011 through 2014, Brent traded above $110 per barrel for an extended period, during years that coincided with economic expansion and a rising equity market. Rising oil prices alone are not automatically a harbinger for recession.

Global Price of Brent Crude, 2003 – Present

What matters is duration and scale. A temporary spike driven by uncertainty is very different from a sustained supply shock that meaningfully removes production from the global system. And so far, energy markets are not behaving as though investors expect a prolonged shutdown of supply.

This could change, of course, and we’ll be watching closely. But it’s also true that the Strait of Hormuz has not been seriously closed since the 1980s, even during periods of heavy regional fighting. Despite recurring fears over the decades, oil shipments have largely continued to flow. Energy markets are adaptive—producers adjust output, shipping routes can be rerouted where possible, strategic reserves can be deployed, and high prices themselves encourage additional supply.

Natural gas adds another dimension to the energy discussion, particularly for Europe and Asia. In 2022, when Europe scrambled to replace Russian pipeline gas, benchmark European natural gas prices soared to extraordinary levels amid fears of winter shortages. That spike was driven not just by conflict, but by a sudden structural loss of supply combined with low storage levels heading into heating season.

Today’s environment looks materially different.

While recent attacks have temporarily raised concerns around LNG production in parts of the Gulf region, global gas inventories are not in the same fragile position they were three years ago. Europe has diversified supply sources, expanded LNG import capacity, and improved storage buffers. Prices have moved higher in response to uncertainty, but they remain far below the extreme levels reached during the 2022 energy crisis.

Importantly, U.S. natural gas prices, which are often a useful barometer of global LNG tightness, have not exhibited the kind of surge typically associated with a sustained global shortage. That suggests markets are pricing risk, not permanent supply destruction. We’re also moving out of winter, which could be an important demand factor.

Could energy prices move higher from here? Certainly. Markets will continue to incorporate new information as the situation evolves. But for this conflict to meaningfully alter the economic trajectory, disruptions would need to be large, sustained, and broad enough to materially impair global demand. That is a high threshold, and I don’t think investors should act as though it’s a foregone conclusion.

Volatility in response to geopolitical events is normal. It has been a feature of markets for decades. The key distinction investors must make is between unsettling headlines and structural economic damage. And at this stage, I do not see evidence of the latter. 

Bottom Line for Investors

The situation in Iran deserves close monitoring, particularly in energy markets. Oil, and to a lesser extent, natural gas, are the primary economic variables to watch. If prices spike sharply and remain elevated, volatility could persist.

But history suggests that regional conflicts tend to produce temporary market disruptions rather than lasting bear markets. The broader economic backdrop of moderating inflation, resilient labor markets, steady earnings growth, and improving market breadth remains intact. Those forces tend to drive longer-term market direction far more than regional conflicts, unless the conflict fundamentally alters global production or consumption patterns. We’re pretty far from that outcome today, in my view.

Wall Street Journal. March 2, 2026. https://advisor.zacksim.com/e/376582/rug-off-this-conflict-bf9f9c62/5v6vv2/1477770604/h/3QTDpSc-IewpJvHmbppoTUcneg0dnwZPPE3m9kvvKeg
Fred Economic Data. February 12, 2026. https://advisor.zacksim.com/e/376582/series-POILBREUSDM/5v6vv5/1477770604/h/3QTDpSc-IewpJvHmbppoTUcneg0dnwZPPE3m9kvvKeg

DISCLOSURE
Past performance is no guarantee of future results. Inherent in any investment is the potential for loss.

Zacks Investment Management, Inc. is a wholly-owned subsidiary of Zacks Investment Research. Zacks Investment Management is an independent Registered Investment Advisory firm and acts as an investment manager for individuals and institutions. Zacks Investment Research is a provider of earnings data and other financial data to institutions and to individuals.

This material is being provided for informational purposes only and nothing herein constitutes investment, legal, accounting or tax advice, or a recommendation to buy, sell or hold a security. Do not act or rely upon the information and advice given in this publication without seeking the services of competent and professional legal, tax, or accounting counsel. Publication and distribution of this article is not intended to create, and the information contained herein does not constitute, an attorney-client relationship. No recommendation or advice is being given as to whether any investment or strategy is suitable for a particular investor. It should not be assumed that any investments in securities, companies, sectors or markets identified and described were or will be profitable. All information is current as of the date of herein and is subject to change without notice. Any views or opinions expressed may not reflect those of the firm as a whole.

Any projections, targets, or estimates in this report are forward looking statements and are based on the firm’s research, analysis, and assumptions. Due to rapidly changing market conditions and the complexity of investment decisions, supplemental information and other sources may be required to make informed investment decisions based on your individual investment objectives and suitability specifications. All expressions of opinions are subject to change without notice. Clients should seek financial advice regarding the appropriateness of investing in any security or investment strategy discussed in this presentation.

Certain economic and market information contained herein has been obtained from published sources prepared by other parties.  Zacks Investment Management does not assume any responsibility for the accuracy or completeness of such information. Further, no third party has assumed responsibility for independently verifying the information contained herein and accordingly no such persons make any representations with respect to the accuracy, completeness or reasonableness of the information provided herein. Unless otherwise indicated, market analysis and conclusions are based upon opinions or assumptions that Zacks Investment Management considers to be reasonable. Any investment inherently involves a high degree of risk, beyond any specific risks discussed herein.

The S&P 500 Index is a well-known, unmanaged index of the prices of 500 large-company common stocks, mainly blue-chip stocks, selected by Standard & Poor’s. The S&P 500 Index assumes reinvestment of dividends but does not reflect advisory fees. The volatility of the benchmark may be materially different from the individual performance obtained by a specific investor. An investor cannot invest directly in an index. 

The Russell 1000 Growth Index is a well-known, unmanaged index of the prices of 1000 large-company growth common stocks selected by Russell. The Russell 1000 Growth Index assumes reinvestment of dividends but does not reflect advisory fees. An investor cannot invest directly in an index. The volatility of the benchmark may be materially different from the individual performance obtained by a specific investor.

Nasdaq Composite Index is the market capitalization-weighted index of over 3,300 common equities listed on the Nasdaq stock exchange. The types of securities in the index include American depositary receipts, common stocks, real estate investment trusts (REITs) and tracking stocks, as well as limited partnership interests. The index includes all Nasdaq-listed stocks that are not derivatives, preferred shares, funds, exchange-traded funds (ETFs) or debenture securities. An investor cannot invest directly in an index. The volatility of the benchmark may be materially different from the individual performance obtained by a specific investor.

The Dow Jones Industrial Average measures the daily stock market movements of 30 U.S. publicly-traded companies listed on the NASDAQ or the New York Stock Exchange (NYSE). The 30 publicly-owned companies are considered leaders in the United States economy. An investor cannot directly invest in an index.  The volatility of the benchmark may be materially different from the individual performance obtained by a specific investor.

The Bloomberg Global Aggregate Index is a flagship measure of global investment grade debt from twenty-four local currency markets. This multi-currency benchmark includes treasury, government-related, corporate and securitized fixed-rate bonds from both developed and emerging markets issuers. An investor cannot invest directly in an index. The volatility of the benchmark may be materially different from the individual performance obtained by a specific investor.

The ICE Exchange-Listed Fixed & Adjustable Rate Preferred Securities Index is a modified market capitalization weighted index composed of preferred stock and securities that are functionally equivalent to preferred stock including, but not limited to, depositary preferred securities, perpetual subordinated debt and certain securities issued by banks and other financial institutions that are eligible for capital treatment with respect to such instruments akin to that received for issuance of straight preferred stock. An investor cannot invest directly in an index. The volatility of the benchmark may be materially different from the individual performance obtained by a specific investor.

The MSCI ACWI ex U.S. Index captures large and mid-cap representation across 22 of 23 Developed Markets (DM) countries (excluding the United States) and 24 Emerging Markets (EM) countries. The index covers approximately 85% of the global equity opportunity set outside the U.S. An investor cannot invest directly in an index. The volatility of the benchmark may be materially different from the individual performance obtained by a specific investor.

The Russell 2000 Index is a well-known, unmanaged index of the prices of 2000 small-cap company common stocks, selected by Russell. The Russell 2000 Index assumes reinvestment of dividends but does not reflect advisory fees. An investor cannot invest directly in an index. The volatility of the benchmark may be materially different from the individual performance obtained by a specific investor.

The S&P Mid Cap 400 provides investors with a benchmark for mid-sized companies. The index, which is distinct from the large-cap S&P 500, is designed to measure the performance of 400 mid-sized companies, reflecting the distinctive risk and return characteristics of this market segment.

The S&P 500 Pure Value index is a style-concentrated index designed to track the performance of stocks that exhibit the strongest value characteristics by using a style-attractiveness-weighting scheme. An investor cannot directly invest in an index.  The volatility of the benchmark may be materially different from the individual performance obtained by a specific investor.

Copyright © 2026. All rights reserved.