
What to Expect from This Report
The pause in trade war tensions has officially passed. As we enter July, the Trump administration has reignited its global tariff strategy, setting new deadlines for dozens of countries to strike new trade deals. Markets have responded with a mix of resilience and caution, as investors weigh the near-term economic risks against an otherwise stable backdrop in jobs and consumer spending.
Earlier in the month, the One Big Beautiful Bill Act passed both chambers of Congress, and it makes permanent several Trump-era tax cuts, raises defense spending, and introduces stricter eligibility requirements for social programs. We’ll review some of the key details of the bill in this report, as well as previewing what to expect from Q2 2025 earnings—starting with banks.
The Trade War is Back On.
Here’s Where Everything Stands The market’s summer break from tariff uncertainty is officially over. On July 7, the Trump administration delayed the imposition of steep reciprocal tariffs by three more weeks to August 1, following an earlier 90- day pause. But the next day, President Trump announced sweeping new measures: a 50% tariff on copper and a 200% tariff on pharmaceutical imports. These announcements reignited concerns that a full-blown trade war could soon resume.1
The reciprocal tariff strategy, first floated on April 2, targets more than 80 countries and would replace the existing 10% baseline tariff on most U.S. imports with much higher, country-specific rates—some as high as 125%. These measures were briefly enacted in April before being paused. Trump has framed the August 1 deadline as firm, stating: “No extensions will be granted.”
On July 7, letters were sent to more than a dozen countries warning of looming tariffs unless new trade agreements are finalized. These letters included tariffs ranging from 25% to 40%, with Japan and South Korea among the nations facing new 25% duties, particularly on automobile exports. Another round of letters was sent on July 9, and Commerce Secretary Howard Lutnick has indicated 15 to 20 more countries will soon be added.
Later that day (after the market closed), President Trump unveiled a 50% tariff on Brazilian goods starting August 1, the steepest yet. In a personal letter to Brazil’s president, Trump criticized the country’s treatment of former president Jair Bolsonaro and accused Brazil of undermining free elections.
Additional sector-specific tariffs are either already in effect or on the horizon. As of June 4, steel and aluminum imports face 50% tariffs (up from 25%), although the U.K. is exempt. Vehicle imports were hit with 25% duties on April 3, and a similar rate was applied to auto parts starting May 3. Pharmaceutical companies will be given up to 18 months to reshore supply chains before their 200% tariff kicks in. Trump has also hinted at possible tariffs on semiconductors, citing national security concerns under Section 232 of the Trade Expansion Act of 1962.
In parallel, we’ve also seen an additional 10% tariffs threatened on countries aligned with the BRICS bloc— Brazil, Russia, India, China, and South Africa—arguing that their trading practices disadvantage the U.S. The administration has also suggested that the EU could be next in line to receive tariff letters, particularly in light of European regulatory actions against U.S. tech companies.
Despite the sweeping scope and rhetoric, financial markets have remained relatively composed. Many investors appear to believe the real economic fallout will be muted, at least in the short term. Labor markets, consumer spending, and corporate earnings have all remained resilient despite ongoing trade tensions. Still, we think it’s possible that prolonged tariff uncertainty could pressure growth and reaccelerate inflation in the months ahead. Investors should stay alert: the next phase of the trade war is no longer a hypothetical— it’s arriving now.
Breaking Down Provisions in the One Big Beautiful Bill Act
A massive piece of legislation has been signed into law. The bill, which passed after a tie-breaking vote in the Senate and late-night wrangling in the House, aims to extend Trump-era tax cuts, significantly boost military and immigration enforcement spending, and apply cuts to social safety net programs.2
The bill’s centerpiece is a permanent extension of the 2017 Tax Cuts and Jobs Act, including higher standard deductions and targeted breaks for retirees and tip earners. But to fund those tax cuts, the bill introduces deep changes to Medicaid, including more frequent re-enrollment requirements, stricter work rules, and reduced provider tax rates.
The legislation also expands the child tax credit, raises the deduction cap for state and local taxes (SALT) from $10,000 to $40,000 for five years, and introduces a phased tax break for overtime and tip income. On the revenue side, the bill lifts the federal debt ceiling by $5 trillion, while also phasing out clean energy tax credits and imposing new restrictions on companies with foreign ties.
Defense and border spending also receive a major boost, with $150 billion earmarked for military projects and $100 billion for Immigration and Customs Enforcement (ICE), doubling migrant detention capacity and expanding enforcement.
Taken together, the bill reflects the administration’s dual focus on tax relief and national security, while ushering in sweeping changes to healthcare and social benefits. Though markets have not yet fully priced in the long-term fiscal implications, the bill’s passage is likely to influence consumer behavior, corporate investment, and political risk premiums starting in the second half of the year.
Q2 Earnings Season Begins: Bank Results in Focus Amid Stabilizing Estimates
The second-quarter earnings season is now underway, with early results from Costco and AutoZone already in and big banks like JPMorgan, Citigroup, and Wells Fargo set to report July 15. Market expectations have come down sharply since the start of Q2, but the pace of estimate cuts has slowed in recent weeks, suggesting sentiment may be bottoming.
S&P 500 earnings for Q2 are projected to rise +5.0% year-over-year on +4.0% higher revenues. That marks a slowdown from Q1’s +12% growth, but a solid showing nonetheless. Three sectors are expected to post double-digit earnings growth: Aerospace (+15.2%), Tech (+12.1%), and Consumer Discretionary (+106.1%). Seven sectors, including Energy (-25.7%), Autos (-31.2%), and Construction (-14.7%), are expected to post declines.
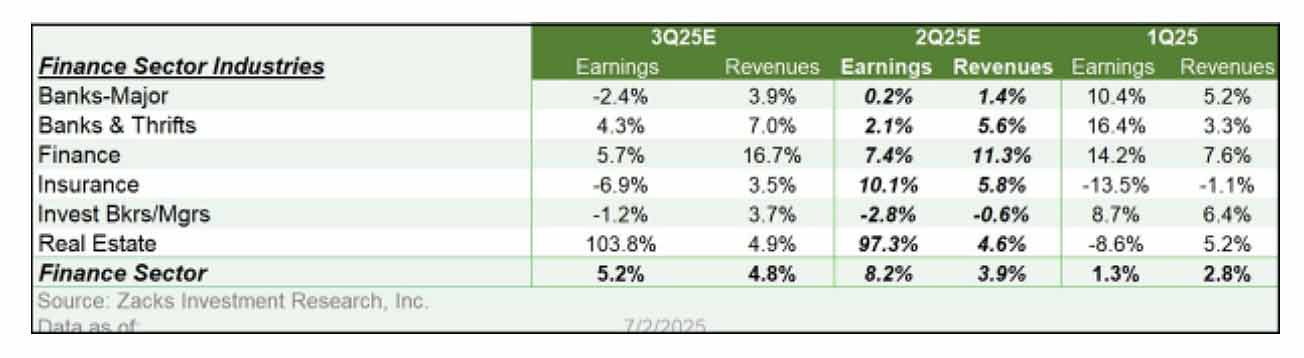
The Finance sector is a key area of focus. While JPMorgan, Citigroup, and Wells Fargo all passed the Fed’s latest stress tests and may increase dividends and buybacks, their Q2 earnings are expected to decline year-over-year. Weak loan growth and tepid investment banking activity continue to weigh on results.
However, the Zacks Finance sector overall is expected to post +8.2% earnings growth on +3.9% revenue, lifted by strength elsewhere in the group.
Expectations for 2025 Q2
The start of Q2 coincided with heightened tariff uncertainty following the punitive April 2nd tariff announcements. While the onset of the announced levies was eventually delayed by three months, the issue has understandably weighed heavily on estimates for the current and upcoming quarters, particularly in the first few weeks following the April 2nd announcement.3
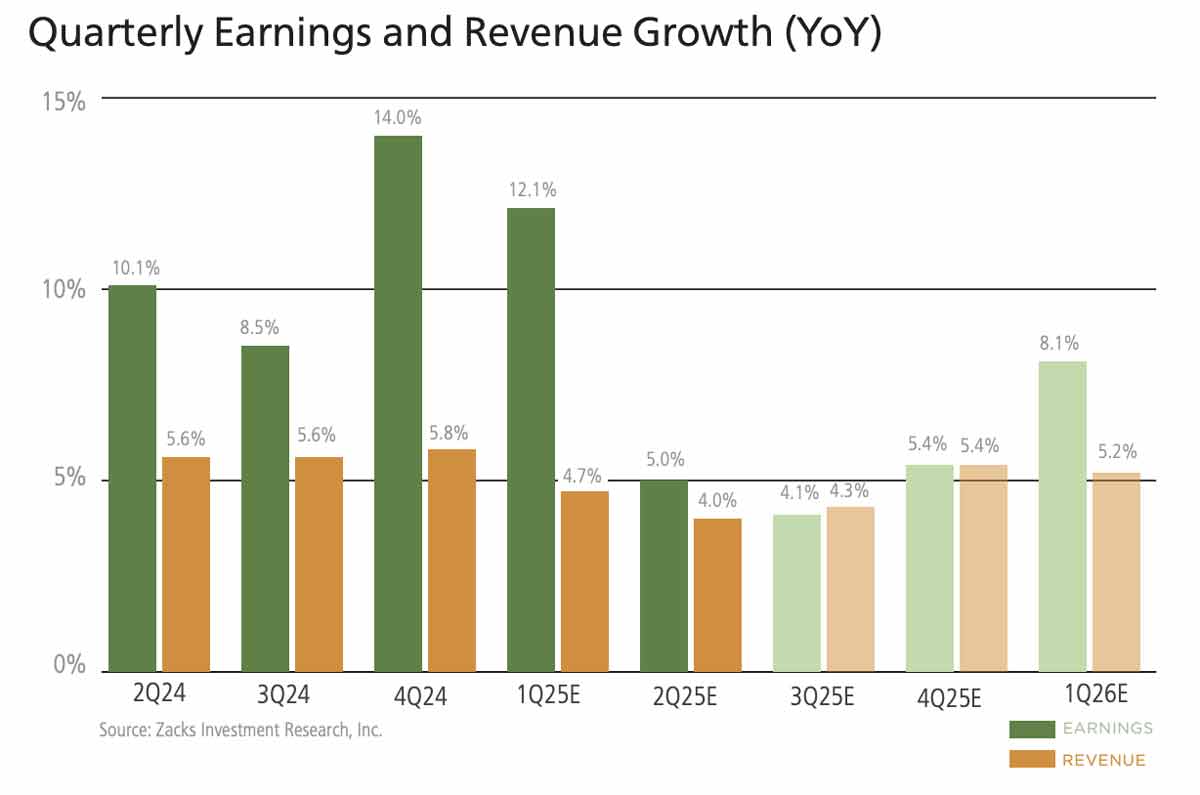
The expectation at present is for Q2 earnings for the S&P 500 index to increase by +5.0% from the same period last year on +4.0% higher revenues. The chart below shows how Q2 earnings growth expectations have evolved since the start of the year.
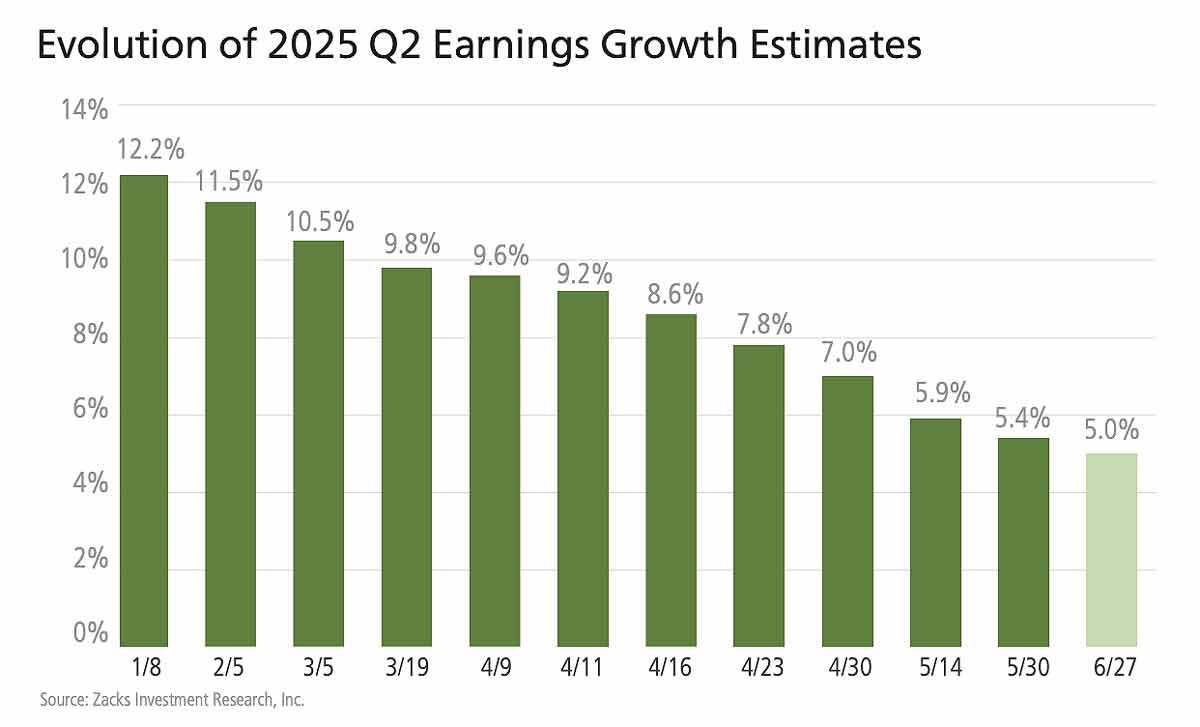
While it is not unusual for estimates to be adjusted lower, the magnitude and breadth of Q2 estimate cuts are greater than we have seen in the comparable periods of other recent quarters. Since the start of the quarter, estimates have come down for 13 of the 16 Zacks sectors, with the biggest declines for the Transportation, Autos, Energy, Construction, and Basic Materials sectors. The only sectors experiencing favorable revisions in this period are Aerospace, Utilities, and Consumer Discretionary.
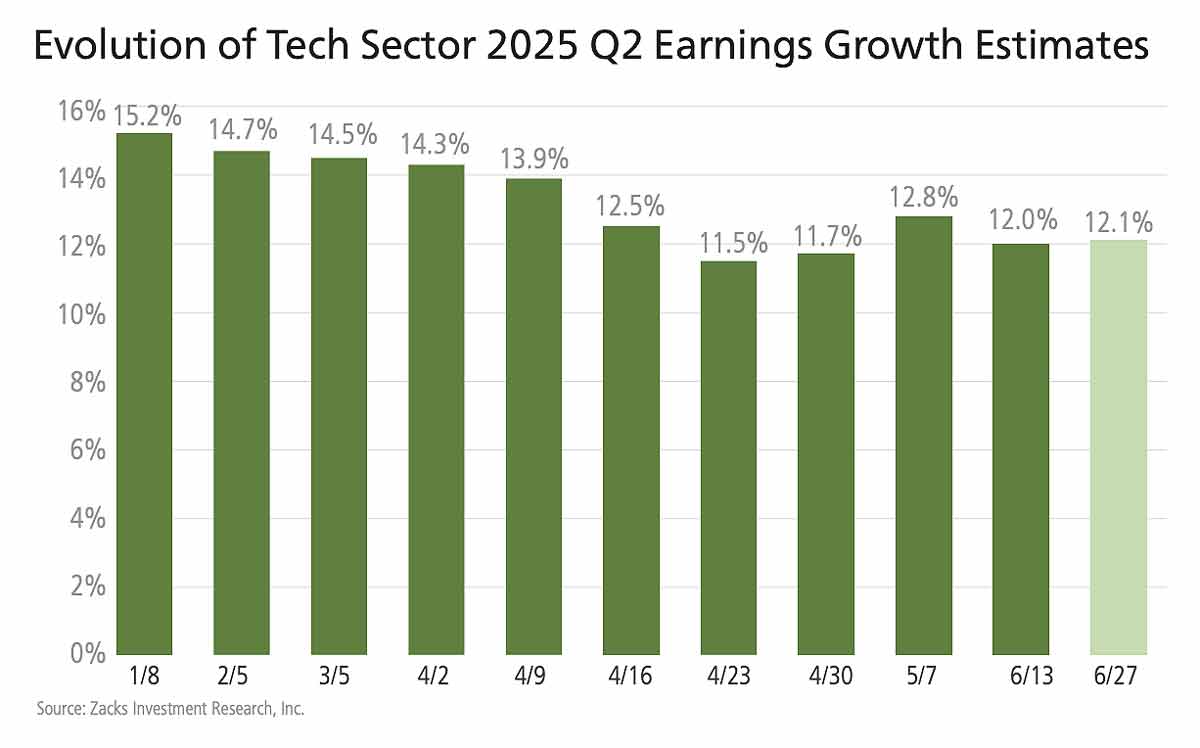
Estimates for the two largest earnings contributors to the index – Tech & Finance – have also declined since the quarter began. Tech sector earnings are expected to be up +12.1% in Q2 on +10.9% higher revenues. While these earnings growth expectations are materially below where they stood at the start of April, the revisions trend appears to have notably stabilized lately, as we have been flagging in recent weeks. You can see this in the sector’s revisions trend in the chart below.
This stabilizing turn in the Tech sector’s revisions trend can be seen in expectations for full-year 2025 as well, as the chart below shows.
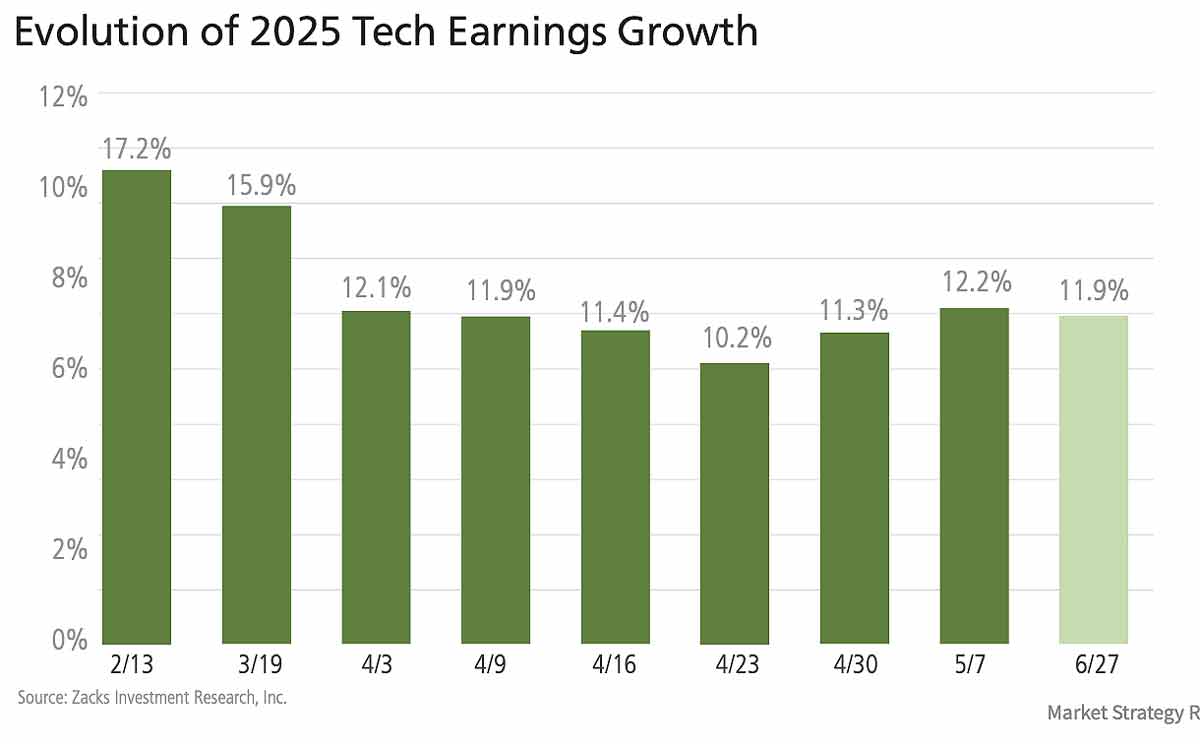
The two charts above show that estimates for the Tech sector have stabilized and are no longer under the type of downward pressure experienced earlier in the quarter. The Tech sector is much more than just any other sector, as it alone accounts for almost a third of all S&P 500 earnings.
The Earnings Big Picture
The chart below shows expectations for 2025 Q2 in terms of what was achieved in the preceding four periods and what is currently expected for the next three quarters.
The chart below shows the overall earnings picture for the S&P 500 index on an annual basis.
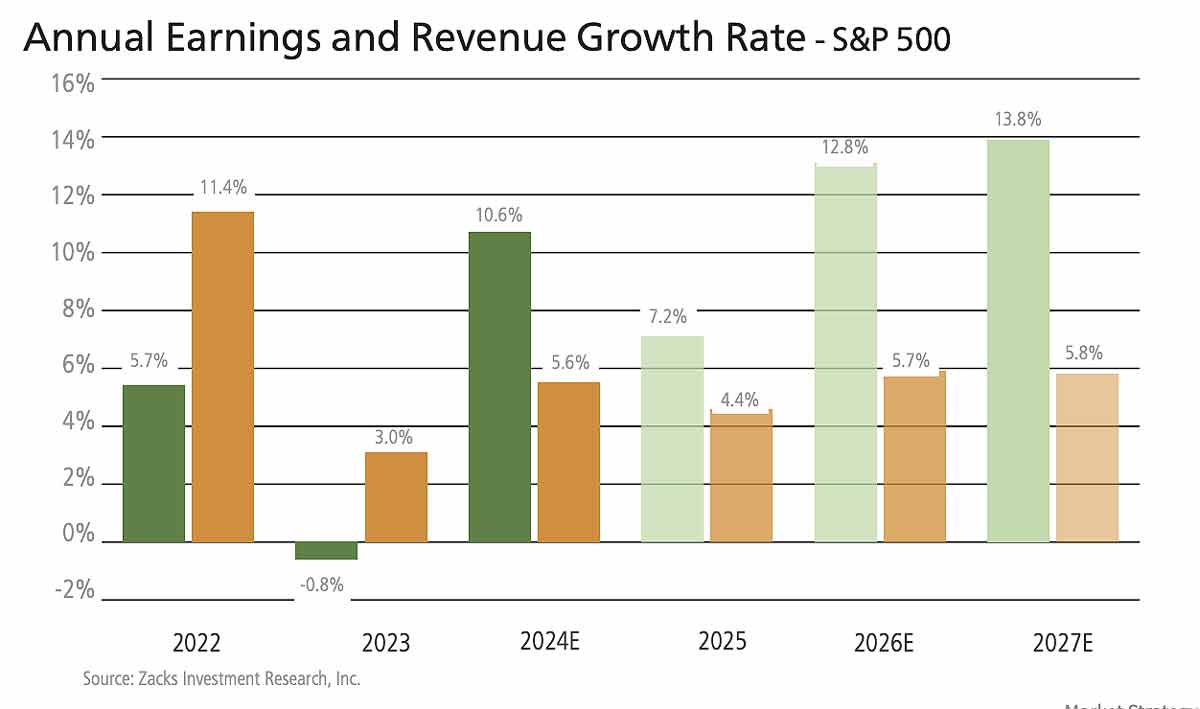
The market’s rebound from the post-tariffs April lows has been very impressive, likely suggesting that market participants don’t see the tariff uncertainty as presenting a significant threat. We find ourselves a bit skeptical of this sanguine view. Whatever the final level of tariffs turns out to be, it will have an impact on the earnings picture.
Bottom Line for Investors
July marks a reacceleration of policy volatility, both on the trade and fiscal front. While the market has largely looked past the latest tariff threats and the partisan wrangling over the budget bill, the underlying economic effects may take months to surface.
Earnings, for now, remain a pillar of support. The pace of estimate cuts has slowed, and certain sectors—most notably Tech and Aerospace—are showing strong growth. But with trade deadlines looming, more trade deficits on the horizon, and core inflation still sticky, it’s important for investors to stay nimble.
Investors should continue to emphasize diversified exposure and keep a close eye on how policy decisions translate into real economic impact. Volatility may stay contained for now, but the second half of 2025 is shaping up to be a critical period for testing the market’s durability.
DISCLAIMER
Past performance is no guarantee of future results. Inherent in any investment is the potential for loss. Zacks Investment Management, Inc. is a wholly-owned subsidiary of Zacks Investment Research. Zacks Investment Management is an independent Registered Investment Advisory firm and acts as an investment manager for individuals and institutions. Zacks Investment Research is a provider of earnings data and other financial data to institutions and to individuals.
This material is being provided for informational purposes only and nothing herein constitutes investment, legal, accounting or tax advice, or a recommendation to buy, sell or hold a security. Do not act or rely upon the information and advice given in this publication without seeking the services of competent and professional legal, tax, or accounting counsel. Publication and distribution of this article is not intended to create, and the information contained herein does not constitute, an attorney-client relationship. No recommendation or advice is being given as to whether any investment or strategy is suitable for a particular investor. It should not be assumed that any investments in securities, companies, sectors or markets identified and described were or will be profitable. All information is current as of the date of herein and is subject to change without notice. Any views or opinions expressed may not reflect those of the firm as a whole.
Any projections, targets, or estimates in this report are forward looking statements and are based on the firm’s research, analysis, and assumptions. Due to rapidly changing market conditions and the complexity of investment decisions, supplemental information and other sources may be required to make informed investment decisions based on your individual investment objectives and suitability specifications. All expressions of opinions are subject to change without notice. Clients should seek financial advice regarding the appropriateness of investing in any security or investment strategy discussed in this presentation.
Certain economic and market information contained herein has been obtained from published sources prepared by other parties. Zacks Investment Management does not assume any responsibility for the accuracy or completeness of such information. Further, no third party has assumed responsibility for independently verifying the information contained herein and accordingly no such persons make any representations with respect to the accuracy, completeness or reasonableness of the information provided herein. Unless otherwise indicated, market analysis and conclusions are based upon opinions or assumptions that Zacks Investment Management considers to be reasonable. Any investment inherently involves a high degree of risk, beyond any specific risks discussed herein.
The S&P 500 Index is a well-known, unmanaged index of the prices of 500 large-company common stocks, mainly bluechip stocks, selected by Standard & Poor’s. The S&P 500 Index assumes reinvestment of dividends but does not reflect advisory fees. The volatility of the benchmark may be materially different from the individual performance obtained by a specific investor. An investor cannot invest directly in an index.
The Russell 1000 Growth Index is a well-known, unmanaged index of the prices of 1000 large-company growth common stocks selected by Russell. The Russell 1000 Growth Index assumes reinvestment of dividends but does not reflect advisory fees. An investor cannot invest directly in an index. The volatility of the benchmark may be materially different from the individual performance obtained by a specific investor.
Nasdaq Composite Index is the market capitalization-weighted index of over 3,300 common equities listed on the Nasdaq stock exchange. The types of securities in the index include American depositary receipts, common stocks, real estate investment trusts (REITs) and tracking stocks, as well as limited partnership interests. The index includes all Nasdaq listed stocks that are not derivatives, preferred shares, funds, exchange-traded funds (ETFs) or debenture securities. An investor cannot invest directly in an index. The volatility of the benchmark may be materially different from the individual performance obtained by a specific investor.
The Dow Jones Industrial Average measures the daily stock market movements of 30 U.S. publicly-traded companies listed on the NASDAQ or the New York Stock Exchange (NYSE). The 30 publicly-owned companies are considered leaders in the United States economy. An investor cannot directly invest in an index. The volatility of the benchmark may be materially different from the individual performance obtained by a specific investor.
The Russell 2000 Index is a well-known, unmanaged index of the prices of 2000 small-cap company common stocks, selected by Russell. The Russell 2000 Index assumes reinvestment of dividends but does not reflect advisory fees. An investor cannot invest directly in an index. The volatility of the benchmark may be materially different from the individual Market Strategy Report 10 MARKET STRATEGY REPORT INVESTMENT MANAGEMENT performance obtained by a specific investor.
The S&P Mid Cap 400 provides investors with a benchmark for mid-sized companies. The index, which is distinct from the large-cap S&P 500, is designed to measure the performance of 400 mid-sized companies, reflecting the distinctive risk and return characteristics of this market segment.
The S&P GSCI is the first major investable commodity index. It is one of the most widely recognized benchmarks that is broad-based and production weighted to represent the global commodity market beta. The index is designed to be investable by including the most liquid commodity futures, and provides diversification with low correlations to other asset classes. The volatility of the benchmark may be materially different from the individual performance obtained by a specific investor.
The Russell 1000 Value Index is a well-known, unmanaged index of the prices of 1000 large-company value common stocks selected by Russell. The Russell 1000 Value Index assumes reinvestment of dividends but does not reflect advisory fees. An investor cannot directly invest in an index. The volatility of the benchmark may be materially different from the individual performance obtained by a specific investor.
The Nikkei Stock Average, the Nikkei 225 is used around the globe as the premier index of Japanese stocks. More than 60 years have passed since the commencement of its calculation, which represents the history of Japanese economy after the World War II. Because of the prominent nature of the index, many financial products linked to the Nikkei 225 have been created are traded worldwide while the index has been sufficiently used as the indicator of the movement of Japanese stock markets. The Nikkei 225 is a price-weighted equity index, which consists of 225 stocks in the 1st section of the Tokyo Stock Exchange. The volatility of the benchmark may be materially different from the individual performance obtained by a specific investor.
The CBOE Volatility Index (VIX) is a calculation designed to produce a measure of constant, 30-day expected volatility of the U.S. stock market, derived from real-time, mid-quote prices of S&P 500 Index call and put options. On a global basis, it is one of the most recognized measures of volatility — widely reported by financial media and closely followed by a variety of market participants as a daily market indicator. The volatility of the benchmark may be materially different from the individual performance obtained by a specific investor. An investor cannot invest directly in an index.
Sources
1 Wall Street Journal. July 9, 2025. https://www.wsj.com/economy/trade/trump-tariffs-countries-goods-explained-b9878e1a?mod=economy_lead_pos1
2 BBC. 2025
3 Zacks. July 2, 2025. https://www.zacks.com/commentary/2561144/looking-ahead-to-bank-earnings