Category

Weekly Market Commentary

Mitch Zacks – Weekly Market Commentary: The Yield Curve Steepens—What Does That Mean for Economic Growth?

By Weekly Market Commentary

A relatively quiet, but crucial shift has been taking place in bond markets recently, with the steepening of the U.S. Treasury yield curve. After spending much of the past three years inverted or flat, the gap between short- and long-term interest rates has begun to widen again, which is a development investors should generally view as constructive for future economic growth.1

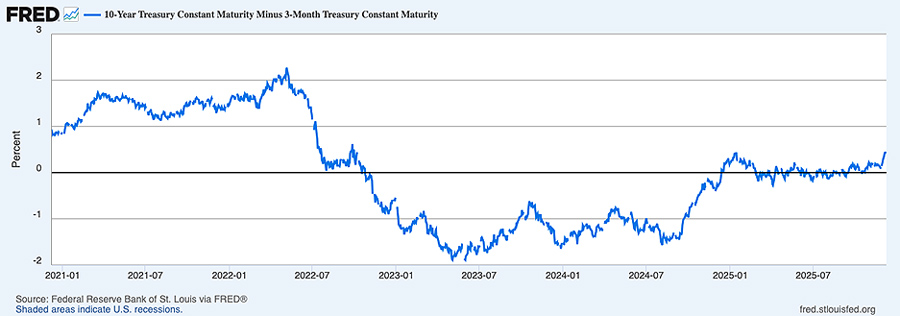
The chart below expresses the yield curve by subtracting short-term Treasury bond yields (3-month) from the 10-year U.S. Treasury bond yield. When the line dips below zero, that means the yield curve is inverted (short-term yields are higher than long-term yields). As readers can see, the line is finally crawling back up into positive territory.

3-month / 10-year U.S. Treasury Bond Yield Curve

Source: Federal Reserve Bank of St. Louis 2

Part of the shift reflects changing expectations around Federal Reserve policy, including the nomination of Kevin Warsh as the next Fed Chair. Markets appear to be interpreting his nomination as a signal that short-term rates could eventually move lower, while long-term rates will reflect supply, demand, and inflation expectations more freely. The view on long rates is based on the fact that Warsh has been vocal over the years about shrinking the Fed’s balance sheet and pulling back from heavy bond-market intervention.

This combination, lower short-term rates and less ‘yield manipulation’ on the long end, naturally points toward a steeper yield curve.

From an economic perspective, a positively sloped yield curve tends to factor as a tailwind for growth, since it supports lending activity. Banks borrow short and lend long, so a wider spread between short-term funding costs and longer-term lending rates improves incentives to extend credit. If businesses can access capital more easily, that’s constructive for investment and growth.

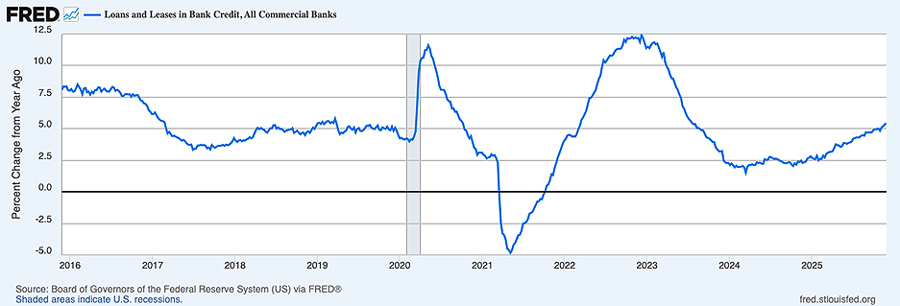
What’s interesting is that the opposite has not necessarily been true over the past few years. Even when the yield curve was inverted for the past two-plus years, bank lending didn’t stall. Total loan growth began in 2025 running at roughly a 2.7% year-over-year pace. By late November, it had accelerated to about 5.4% year over year. That is a meaningful improvement, especially considering rates were largely unchanged for much of the year and liquidity conditions were, by conventional standards, tightening rather than easing. As seen on the chart below, showing the year-over-year change in loans and leases in bank credit (in billions of U.S. dollars), credit has been flowing solidly since 2022.

Bank Lending (Year-over-Year Change in Billions of U.S. Dollars)

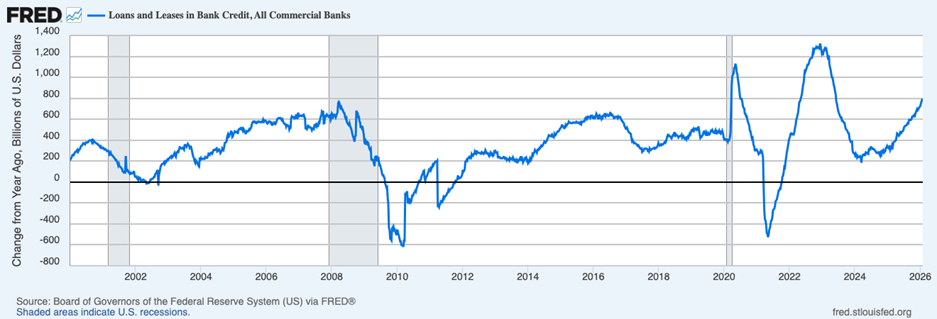
Source: Federal Reserve Bank of St. Louis 3

If lending strengthened in 2025 despite relatively tight policy conditions and a flat yield curve, it suggests the economy was already standing on a fairly solid footing. The read here for investors is that looking ahead, a steepening curve is a positive signal, but not because it suddenly “unlocks” growth. Rather, I see the steepening yield curve as reinforcing a trend that was already in place, which reflects normalization. And that’s a good thing, in my view.

Bottom Line for Investors

The yield curve steepening is a constructive development, and it fits with a broader picture of an economy that has generally been healthier than appreciated. Equally important, the past two years showed that growth and lending will not always grind to a halt simply because the curve is inverted, reminding us that many other forces are at work.

But there’s another takeaway here for investors: just as the inverted yield curve for much of 2023 did not signal an imminent recession, a steepening yield curve in 2026 should not necessarily be viewed as a critical turning point for big growth ahead. We’re expecting growth to be solid this year, to be sure. But we expected that outcome even with a flat yield curve, underscoring the fact that lending, spending, and growth have been strong even without a traditionally steep yield curve. In that sense, the recent steepening looks less like a prerequisite for growth and more like an added tailwind to an economy that was already in good shape.

Wall Street Journal. January 31, 2026. https://advisor.zacksim.com/e/376582/i1WiljnrifkKiDv64j154vmpAA3D3D/5v4q6k/1462235389/h/L8P_TOFJ4WYshjSJYlqvePaYN-TpiLeuioNeejw7qRw

Fred Economic Data. February 10, 2026. https://advisor.zacksim.com/e/376582/series-T10Y3M/5v4q6n/1462235389/h/L8P_TOFJ4WYshjSJYlqvePaYN-TpiLeuioNeejw7qRw

Fred Economic Data. February 6, 2026. https://advisor.zacksim.com/e/376582/series-TOTLL/5v4q6r/1462235389/h/L8P_TOFJ4WYshjSJYlqvePaYN-TpiLeuioNeejw7qRw

DISCLOSURE
Past performance is no guarantee of future results. Inherent in any investment is the potential for loss.

Zacks Investment Management, Inc. is a wholly-owned subsidiary of Zacks Investment Research. Zacks Investment Management is an independent Registered Investment Advisory firm and acts as an investment manager for individuals and institutions. Zacks Investment Research is a provider of earnings data and other financial data to institutions and to individuals.

This material is being provided for informational purposes only and nothing herein constitutes investment, legal, accounting or tax advice, or a recommendation to buy, sell or hold a security. Do not act or rely upon the information and advice given in this publication without seeking the services of competent and professional legal, tax, or accounting counsel. Publication and distribution of this article is not intended to create, and the information contained herein does not constitute, an attorney-client relationship. No recommendation or advice is being given as to whether any investment or strategy is suitable for a particular investor. It should not be assumed that any investments in securities, companies, sectors or markets identified and described were or will be profitable. All information is current as of the date of herein and is subject to change without notice. Any views or opinions expressed may not reflect those of the firm as a whole.

Any projections, targets, or estimates in this report are forward looking statements and are based on the firm’s research, analysis, and assumptions. Due to rapidly changing market conditions and the complexity of investment decisions, supplemental information and other sources may be required to make informed investment decisions based on your individual investment objectives and suitability specifications. All expressions of opinions are subject to change without notice. Clients should seek financial advice regarding the appropriateness of investing in any security or investment strategy discussed in this presentation.

Certain economic and market information contained herein has been obtained from published sources prepared by other parties.  Zacks Investment Management does not assume any responsibility for the accuracy or completeness of such information. Further, no third party has assumed responsibility for independently verifying the information contained herein and accordingly no such persons make any representations with respect to the accuracy, completeness or reasonableness of the information provided herein. Unless otherwise indicated, market analysis and conclusions are based upon opinions or assumptions that Zacks Investment Management considers to be reasonable. Any investment inherently involves a high degree of risk, beyond any specific risks discussed herein.

The S&P 500 Index is a well-known, unmanaged index of the prices of 500 large-company common stocks, mainly blue-chip stocks, selected by Standard & Poor’s. The S&P 500 Index assumes reinvestment of dividends but does not reflect advisory fees. The volatility of the benchmark may be materially different from the individual performance obtained by a specific investor. An investor cannot invest directly in an index.

The Russell 1000 Growth Index is a well-known, unmanaged index of the prices of 1000 large-company growth common stocks selected by Russell. The Russell 1000 Growth Index assumes reinvestment of dividends but does not reflect advisory fees. An investor cannot invest directly in an index. The volatility of the benchmark may be materially different from the individual performance obtained by a specific investor.

Nasdaq Composite Index is the market capitalization-weighted index of over 3,300 common equities listed on the Nasdaq stock exchange. The types of securities in the index include American depositary receipts, common stocks, real estate investment trusts (REITs) and tracking stocks, as well as limited partnership interests. The index includes all Nasdaq-listed stocks that are not derivatives, preferred shares, funds, exchange-traded funds (ETFs) or debenture securities. An investor cannot invest directly in an index. The volatility of the benchmark may be materially different from the individual performance obtained by a specific investor.

The Dow Jones Industrial Average measures the daily stock market movements of 30 U.S. publicly-traded companies listed on the NASDAQ or the New York Stock Exchange (NYSE). The 30 publicly-owned companies are considered leaders in the United States economy. An investor cannot directly invest in an index.  The volatility of the benchmark may be materially different from the individual performance obtained by a specific investor.

The Bloomberg Global Aggregate Index is a flagship measure of global investment grade debt from twenty-four local currency markets. This multi-currency benchmark includes treasury, government-related, corporate and securitized fixed-rate bonds from both developed and emerging markets issuers. An investor cannot invest directly in an index. The volatility of the benchmark may be materially different from the individual performance obtained by a specific investor.

The ICE Exchange-Listed Fixed & Adjustable Rate Preferred Securities Index is a modified market capitalization weighted index composed of preferred stock and securities that are functionally equivalent to preferred stock including, but not limited to, depositary preferred securities, perpetual subordinated debt and certain securities issued by banks and other financial institutions that are eligible for capital treatment with respect to such instruments akin to that received for issuance of straight preferred stock. An investor cannot invest directly in an index. The volatility of the benchmark may be materially different from the individual performance obtained by a specific investor.

The MSCI ACWI ex U.S. Index captures large and mid-cap representation across 22 of 23 Developed Markets (DM) countries (excluding the United States) and 24 Emerging Markets (EM) countries. The index covers approximately 85% of the global equity opportunity set outside the U.S. An investor cannot invest directly in an index. The volatility of the benchmark may be materially different from the individual performance obtained by a specific investor.

The Russell 2000 Index is a well-known, unmanaged index of the prices of 2000 small-cap company common stocks, selected by Russell. The Russell 2000 Index assumes reinvestment of dividends but does not reflect advisory fees. An investor cannot invest directly in an index. The volatility of the benchmark may be materially different from the individual performance obtained by a specific investor.

The S&P Mid Cap 400 provides investors with a benchmark for mid-sized companies. The index, which is distinct from the large-cap S&P 500, is designed to measure the performance of 400 mid-sized companies, reflecting the distinctive risk and return characteristics of this market segment.

The S&P 500 Pure Value index is a style-concentrated index designed to track the performance of stocks that exhibit the strongest value characteristics by using a style-attractiveness-weighting scheme. An investor cannot directly invest in an index.  The volatility of the benchmark may be materially different from the individual performance obtained by a specific investor.

Mitch Zacks – Weekly Market Commentary: “Precious Metals Rally Underscores the Hazards of Chasing Heat”

By Weekly Market Commentary

Gold and silver are all over the news. That alone should give investors pause.

In my read of the current market environment, the rally in precious metals is increasingly being supported by a growing list of rationales for why prices are sure to keep rising. Chief among them:

  • Trade tensions and tariff uncertainty have prompted central banks to ‘hedge’, increasing purchases of gold reserves.
  • Ongoing geopolitical risks, spanning the Middle East to Eastern Europe to Venezuela and Greenland, have reinforced the appeal of perceived “safe havens.”
  • Concerns that heavy government spending and monetary stimulus (via lack of Fed independence) could weaken the dollar and thus strengthen the appeal of gold.
  • And somewhat classically, as prices kept moving higher, fear of missing out has pulled in more retail dollars.

It’s worth stepping back and recognizing what these arguments above have in common. They are largely forward-looking concerns that often bake in worst-case outcomes and rest on several assumptions at once. The critical question for investors isn’t whether these risks exist, but what happens if reality turns out to be less dire than expected.

We saw a clear example of that just last week.

When news broke that Kevin Warsh would be nominated as the next Chair of the Federal Reserve, precious metals sharply sold off. Markets broadly view Warsh as a disciplined, independent central banker—someone who has argued for a smaller Federal Reserve balance sheet and a more restrained approach to monetary policy. That perception alone was enough to force a reassessment of the so-called “dollar debasement” trade that had been supporting gold and silver prices. No policy had changed, but an assumption had. Prices adjusted accordingly.

In my view, this example offered a timely reminder of how quickly sentiment-driven trades can reverse when expectations shift. The outcome was less-bad-than-feared, which unwound the rationale for ever-rising prices.

History offers plenty of similar lessons. During the Greek sovereign debt crisis in the early 2010s, investors worried that financial stress would spread throughout Europe and threaten the global system. Gold surged to record highs amid those fears, widely promoted as a necessary portfolio hedge. Yet as sentiment cooled and the debt crisis was contained, gold went on to fall more than 40% to a trough in 2015, four years later.​​​​​​

The 2008 Global Financial Crisis provides another example. In theory, 2008 should have been an ideal environment for gold. Instead, during the most acute phase of the crisis, gold declined alongside other risk assets as investors sought liquidity and reduced exposure broadly. The takeaway isn’t that gold is a bad investment; it’s that assets driven primarily by sentiment can behave in unexpected ways precisely when investors expect them to provide protection.

This pattern isn’t unique to commodities. Financial markets are full of episodes where investors chase recent winners based on narratives that feel compelling in the moment, only to discover later that price momentum and emotion—not durable fundamentals—were doing most of the work. When those emotions shift, reversals can take hold quickly.

Remember, long-term investment success does not rely on identifying the hottest trade of the moment. It is built on aligning portfolios with financial goals, time horizons, and risk tolerance, and building an allocation of assets with identifiable drivers of return. Stocks generate earnings and cash flow. Bonds provide income and contractual payments. Their returns can fluctuate, sometimes sharply, but they remain tethered to economic activity. Gold does not have these properties.

Bottom Line for Investors

It is easy to feel pressure to act when a particular asset is getting attention and prices are moving quickly. As gold’s recent run shows, those moves are often supported by a stack of assumptions that can change faster than investors expect.

The key takeaway here is not about the pros and cons of owning gold. It is about recognizing how sentiment-driven trades behave. When prices are rising on narratives rather than fundamentals, reversals can happen quickly once expectations shift. For long-term investors, the more reliable approach is to focus on asset allocations built around financial goals, time horizons, and risk tolerance, and rely on assets with identifiable drivers of return. It also means resisting the urge to chase what’s hot simply because it’s getting attention.

DISCLOSURE
Past performance is no guarantee of future results. Inherent in any investment is the potential for loss.

Zacks Investment Management, Inc. is a wholly-owned subsidiary of Zacks Investment Research. Zacks Investment Management is an independent Registered Investment Advisory firm and acts as an investment manager for individuals and institutions. Zacks Investment Research is a provider of earnings data and other financial data to institutions and to individuals.

This material is being provided for informational purposes only and nothing herein constitutes investment, legal, accounting or tax advice, or a recommendation to buy, sell or hold a security. Do not act or rely upon the information and advice given in this publication without seeking the services of competent and professional legal, tax, or accounting counsel. Publication and distribution of this article is not intended to create, and the information contained herein does not constitute, an attorney-client relationship. No recommendation or advice is being given as to whether any investment or strategy is suitable for a particular investor. It should not be assumed that any investments in securities, companies, sectors or markets identified and described were or will be profitable. All information is current as of the date of herein and is subject to change without notice. Any views or opinions expressed may not reflect those of the firm as a whole.

Any projections, targets, or estimates in this report are forward looking statements and are based on the firm’s research, analysis, and assumptions. Due to rapidly changing market conditions and the complexity of investment decisions, supplemental information and other sources may be required to make informed investment decisions based on your individual investment objectives and suitability specifications. All expressions of opinions are subject to change without notice. Clients should seek financial advice regarding the appropriateness of investing in any security or investment strategy discussed in this presentation.

Certain economic and market information contained herein has been obtained from published sources prepared by other parties.  Zacks Investment Management does not assume any responsibility for the accuracy or completeness of such information. Further, no third party has assumed responsibility for independently verifying the information contained herein and accordingly no such persons make any representations with respect to the accuracy, completeness or reasonableness of the information provided herein. Unless otherwise indicated, market analysis and conclusions are based upon opinions or assumptions that Zacks Investment Management considers to be reasonable. Any investment inherently involves a high degree of risk, beyond any specific risks discussed herein.

The S&P 500 Index is a well-known, unmanaged index of the prices of 500 large-company common stocks, mainly blue-chip stocks, selected by Standard & Poor’s. The S&P 500 Index assumes reinvestment of dividends but does not reflect advisory fees. The volatility of the benchmark may be materially different from the individual performance obtained by a specific investor. An investor cannot invest directly in an index.

The Russell 1000 Growth Index is a well-known, unmanaged index of the prices of 1000 large-company growth common stocks selected by Russell. The Russell 1000 Growth Index assumes reinvestment of dividends but does not reflect advisory fees. An investor cannot invest directly in an index. The volatility of the benchmark may be materially different from the individual performance obtained by a specific investor.

Nasdaq Composite Index is the market capitalization-weighted index of over 3,300 common equities listed on the Nasdaq stock exchange. The types of securities in the index include American depositary receipts, common stocks, real estate investment trusts (REITs) and tracking stocks, as well as limited partnership interests. The index includes all Nasdaq-listed stocks that are not derivatives, preferred shares, funds, exchange-traded funds (ETFs) or debenture securities. An investor cannot invest directly in an index. The volatility of the benchmark may be materially different from the individual performance obtained by a specific investor.

The Dow Jones Industrial Average measures the daily stock market movements of 30 U.S. publicly-traded companies listed on the NASDAQ or the New York Stock Exchange (NYSE). The 30 publicly-owned companies are considered leaders in the United States economy. An investor cannot directly invest in an index.  The volatility of the benchmark may be materially different from the individual performance obtained by a specific investor.

The Bloomberg Global Aggregate Index is a flagship measure of global investment grade debt from twenty-four local currency markets. This multi-currency benchmark includes treasury, government-related, corporate and securitized fixed-rate bonds from both developed and emerging markets issuers. An investor cannot invest directly in an index. The volatility of the benchmark may be materially different from the individual performance obtained by a specific investor.

The ICE Exchange-Listed Fixed & Adjustable Rate Preferred Securities Index is a modified market capitalization weighted index composed of preferred stock and securities that are functionally equivalent to preferred stock including, but not limited to, depositary preferred securities, perpetual subordinated debt and certain securities issued by banks and other financial institutions that are eligible for capital treatment with respect to such instruments akin to that received for issuance of straight preferred stock. An investor cannot invest directly in an index. The volatility of the benchmark may be materially different from the individual performance obtained by a specific investor.

The MSCI ACWI ex U.S. Index captures large and mid-cap representation across 22 of 23 Developed Markets (DM) countries (excluding the United States) and 24 Emerging Markets (EM) countries. The index covers approximately 85% of the global equity opportunity set outside the U.S. An investor cannot invest directly in an index. The volatility of the benchmark may be materially different from the individual performance obtained by a specific investor.

The Russell 2000 Index is a well-known, unmanaged index of the prices of 2000 small-cap company common stocks, selected by Russell. The Russell 2000 Index assumes reinvestment of dividends but does not reflect advisory fees. An investor cannot invest directly in an index. The volatility of the benchmark may be materially different from the individual performance obtained by a specific investor.

The S&P Mid Cap 400 provides investors with a benchmark for mid-sized companies. The index, which is distinct from the large-cap S&P 500, is designed to measure the performance of 400 mid-sized companies, reflecting the distinctive risk and return characteristics of this market segment.

The S&P 500 Pure Value index is a style-concentrated index designed to track the performance of stocks that exhibit the strongest value characteristics by using a style-attractiveness-weighting scheme. An investor cannot directly invest in an index.  The volatility of the benchmark may be materially different from the individual performance obtained by a specific investor.

Mitch Zacks – Weekly Market Commentary: “On My Radar: Rising Redemptions in Private Credit Funds”

By Weekly Market Commentary

Private credit funds have grown in popularity over the past few years. Marketed as a way to earn steady income, reduce volatility, and diversify beyond traditional stocks and bonds, these strategies found a receptive audience during a period of rising interest rates and strong demand for yield.

But last year offered a meaningful test of how these products behave when conditions shift.1

According to recent disclosures and reporting, several large private credit funds received redemption requests above their quarterly limits at the end of last year. In most cases, about 5% of fund assets were requested for withdrawal in a single quarter. This is a relatively high figure.

For investors who may not be familiar with these products, private credit funds, particularly business development companies (BDCs), typically lend to midsize companies with below-investment-grade credit ratings. The income they generate, and distribute to investors, comes largely from interest payments on those loans. When short-term interest rates rose sharply in 2022 and 2023, yields followed. Many private-credit strategies were distributing income north of 10%, making them especially attractive to income-focused investors.

But that relationship works both ways.

As interest rates stabilized and began to ease, loan yields tend to fall in lockstep. The result: several large private-credit funds have already reduced dividends, which has created a stir amongst investors (and also helps explain high distribution rates).

The numbers tell the story. Total returns from five of the largest private credit funds aimed at individual investors averaged about 11.4% in 2023, fell to roughly 8.8% in 2024, and declined further to around 6.2% in the first nine months of 2025. Those returns are still positive, but they are meaningfully lower than many investors had come to expect based on recent history.

But here’s the big issue. When investors see falling yields and attempt to shift their income strategy or move their money elsewhere, many realize for the first time that they cannot access all of their money. Many private credit funds are “semi-liquid,” meaning investors can request redemptions quarterly, but at a capped rate—often at 5% of fund assets per quarter, or 2% per month.

During periods of calm, redemption limits may not be much of an issue for long-term investors. But during periods of uncertainty and/or falling yields, they suddenly matter a great deal.

Limited liquidity and income variability can easily clash with the expectation of stability. For institutions with long-dated liabilities and stable capital, these limits are well understood and planned for. But limits don’t always align with the financial realities of individuals, who may need access to cash for healthcare expenses, tuition, or unexpected life events.

We saw a similar dynamic play out several years ago in private real estate, when redemption requests surged and funds were forced to restrict withdrawals. The lesson then, and now, is that liquidity constraints are not necessarily a flaw in these products. They are a feature. They allow managers to avoid forced asset sales and protect long-term investors. But they also require investors to plan carefully for near-term cash needs elsewhere.

None of this means private credit is “bad” or unsuitable in all cases. But it does mean the trade-offs are very important for investors to acknowledge and understand, and they become highly relevant precisely when conditions are less favorable.

Bottom Line for Investors

At this moment, the recent uptick in private credit redemptions does not constitute a crisis. But it does serve as an important reminder.

Private markets can play a role in diversified portfolios, but they demand a clear understanding of how returns are generated, how income can change, and when capital can realistically be accessed. Liquidity constraints become most important when markets turn choppy.

As efforts continue to broaden access to private investments, education matters more than ever. Investors should ask not only what a strategy offers when conditions are ideal, but how it behaves when expectations shift.

Wall Street Journal. January 21, 2026, https://advisor.zacksim.com/e/376582/-bc1e8cbc-mod-livecoverage-web/5v31n8/1448452501/h/yiEtBIn2YzHEb4yy6d38GViOVcfZY_n9dzfHx-EajoE

DISCLOSURE
Past performance is no guarantee of future results. Inherent in any investment is the potential for loss.

Zacks Investment Management, Inc. is a wholly-owned subsidiary of Zacks Investment Research. Zacks Investment Management is an independent Registered Investment Advisory firm and acts as an investment manager for individuals and institutions. Zacks Investment Research is a provider of earnings data and other financial data to institutions and to individuals.

This material is being provided for informational purposes only and nothing herein constitutes investment, legal, accounting or tax advice, or a recommendation to buy, sell or hold a security. Do not act or rely upon the information and advice given in this publication without seeking the services of competent and professional legal, tax, or accounting counsel. Publication and distribution of this article is not intended to create, and the information contained herein does not constitute, an attorney-client relationship. No recommendation or advice is being given as to whether any investment or strategy is suitable for a particular investor. It should not be assumed that any investments in securities, companies, sectors or markets identified and described were or will be profitable. All information is current as of the date of herein and is subject to change without notice. Any views or opinions expressed may not reflect those of the firm as a whole.

Any projections, targets, or estimates in this report are forward looking statements and are based on the firm’s research, analysis, and assumptions. Due to rapidly changing market conditions and the complexity of investment decisions, supplemental information and other sources may be required to make informed investment decisions based on your individual investment objectives and suitability specifications. All expressions of opinions are subject to change without notice. Clients should seek financial advice regarding the appropriateness of investing in any security or investment strategy discussed in this presentation.

Certain economic and market information contained herein has been obtained from published sources prepared by other parties.  Zacks Investment Management does not assume any responsibility for the accuracy or completeness of such information. Further, no third party has assumed responsibility for independently verifying the information contained herein and accordingly no such persons make any representations with respect to the accuracy, completeness or reasonableness of the information provided herein. Unless otherwise indicated, market analysis and conclusions are based upon opinions or assumptions that Zacks Investment Management considers to be reasonable. Any investment inherently involves a high degree of risk, beyond any specific risks discussed herein.

The S&P 500 Index is a well-known, unmanaged index of the prices of 500 large-company common stocks, mainly blue-chip stocks, selected by Standard & Poor’s. The S&P 500 Index assumes reinvestment of dividends but does not reflect advisory fees. The volatility of the benchmark may be materially different from the individual performance obtained by a specific investor. An investor cannot invest directly in an index.

The Russell 1000 Growth Index is a well-known, unmanaged index of the prices of 1000 large-company growth common stocks selected by Russell. The Russell 1000 Growth Index assumes reinvestment of dividends but does not reflect advisory fees. An investor cannot invest directly in an index. The volatility of the benchmark may be materially different from the individual performance obtained by a specific investor.

Nasdaq Composite Index is the market capitalization-weighted index of over 3,300 common equities listed on the Nasdaq stock exchange. The types of securities in the index include American depositary receipts, common stocks, real estate investment trusts (REITs) and tracking stocks, as well as limited partnership interests. The index includes all Nasdaq-listed stocks that are not derivatives, preferred shares, funds, exchange-traded funds (ETFs) or debenture securities. An investor cannot invest directly in an index. The volatility of the benchmark may be materially different from the individual performance obtained by a specific investor.

The Dow Jones Industrial Average measures the daily stock market movements of 30 U.S. publicly-traded companies listed on the NASDAQ or the New York Stock Exchange (NYSE). The 30 publicly-owned companies are considered leaders in the United States economy. An investor cannot directly invest in an index.  The volatility of the benchmark may be materially different from the individual performance obtained by a specific investor.

The Bloomberg Global Aggregate Index is a flagship measure of global investment grade debt from twenty-four local currency markets. This multi-currency benchmark includes treasury, government-related, corporate and securitized fixed-rate bonds from both developed and emerging markets issuers. An investor cannot invest directly in an index. The volatility of the benchmark may be materially different from the individual performance obtained by a specific investor.

The ICE Exchange-Listed Fixed & Adjustable Rate Preferred Securities Index is a modified market capitalization weighted index composed of preferred stock and securities that are functionally equivalent to preferred stock including, but not limited to, depositary preferred securities, perpetual subordinated debt and certain securities issued by banks and other financial institutions that are eligible for capital treatment with respect to such instruments akin to that received for issuance of straight preferred stock. An investor cannot invest directly in an index. The volatility of the benchmark may be materially different from the individual performance obtained by a specific investor.

The MSCI ACWI ex U.S. Index captures large and mid-cap representation across 22 of 23 Developed Markets (DM) countries (excluding the United States) and 24 Emerging Markets (EM) countries. The index covers approximately 85% of the global equity opportunity set outside the U.S. An investor cannot invest directly in an index. The volatility of the benchmark may be materially different from the individual performance obtained by a specific investor.

The Russell 2000 Index is a well-known, unmanaged index of the prices of 2000 small-cap company common stocks, selected by Russell. The Russell 2000 Index assumes reinvestment of dividends but does not reflect advisory fees. An investor cannot invest directly in an index. The volatility of the benchmark may be materially different from the individual performance obtained by a specific investor.

The S&P Mid Cap 400 provides investors with a benchmark for mid-sized companies. The index, which is distinct from the large-cap S&P 500, is designed to measure the performance of 400 mid-sized companies, reflecting the distinctive risk and return characteristics of this market segment.

The S&P 500 Pure Value index is a style-concentrated index designed to track the performance of stocks that exhibit the strongest value characteristics by using a style-attractiveness-weighting scheme. An investor cannot directly invest in an index.  The volatility of the benchmark may be materially different from the individual performance obtained by a specific investor.

Mitch Zacks – Market Strategy Report – January 2026

By Weekly Market Commentary

What to Expect from This Report MARKET STRATEGY REPORT

We’re holding a constructive outlook for both economic growth and corporate earnings in 2026. Equity markets should benefit from this fundamental strength, in our view. But there are two more reasons stocks could feel tailwinds in 2026: accommodative fiscal and monetary policy.

The Federal Reserve already resumed rate cuts in late 2025, and we think the conditions—moderating inflation, weak jobs market data—for additional cuts are becoming evident. On the fiscal side of the ledger, the One Big Beautiful Bill Act (OBBBA) is poised to deliver near term stimulus in the form of refunds/credits for both businesses and households, which lift disposable income, capex, and margins. In a midterm election year, we could also see additional fiscal stimulus to ‘juice’ the economy, and those proposals are already being floated by the Trump administration.1

In this report we’ll also address the Venezuela issue, separating Venezuela’s geopolitics from investable math, showing why sub-1% global output and slow-to-scale oil capacity argue for limited, slow-moving effects on prices and Energy earnings. Lastly, we’ll zoom out to earnings: Tech remains a powerful engine, but the setup favors broader participation in 2026, with revisions and cash-flow dynamics doing more heavy lifting than headlines.

How Fiscal + Monetary Policy Could Form a 2026 Tailwind

2026 is setting up for what we’re calling a “policy one-two”: lagged effects of Fed easing with the potential for more rate cuts on deck, combined with a visible fiscal impulse from the One Big Beautiful Bill Act (OBBBA) and additional f iscal stimulus proposals that the Trump administration seems poised to pursue.

Let’s start with monetary policy.

December’s employment report capped a weak year for hiring, with total job gains in 2025 averaging fewer than 50,000 per month—the slowest pace outside of recessions since the early 2000s. While the unemployment rate edged lower to 4.4% in the latest jobs report, other indicators point to softening beneath the surface. Average weekly hours declined, temporary help employment fell, and long-term unemployment rose. Job growth became increasingly concentrated in healthcare and leisure, while manufacturing employment continued to contract.

In our view (assuming inflation doesn’t reaccelerate), this should open the door for further easing in 2026. Markets broadly expect additional policy support.

The Fed has already cut rates at the last two meetings, and financial conditions have been easing. We think this will continue to serve as a positive tailwind for stocks.

On the fiscal side, the OBBBA is designed to arrive in 2026 in a way households will actually feel. Rather than mid-year paycheck withholding changes, the bill channels relief through tax filing season. Some estimates call for an aggregate 44% jump in 2026 tax refunds versus this year, roughly $150 billion flowing to consumers.

Download Full Market Strategy Report

1 Wall Street Journal. January 13, 2026. https://www.wsj.com/politics/policy/in-pivot-on-affordability-trump-unveils-barrage-of-proposals-to-address-costs961e4343?mod=article_inline

DISCLAIMER

Past performance is no guarantee of future results. Inherent in any investment is the potential for loss. Zacks Investment Management, Inc. is a wholly-owned subsidiary of Zacks Investment Research.

Zacks Investment Management is an independent Registered Investment Advisory firm and acts as an investment manager for individuals and institutions. Zacks Investment Research is a provider of earnings data and other financial data to institutions and to individuals.

This material is being provided for informational purposes only and nothing herein constitutes investment, legal, accounting or tax advice, or a recommendation to buy, sell or hold a security. Do not act or rely upon the information and advice given in this publication without seeking the services of competent and professional legal, tax, or accounting counsel. Publication and distribution of this article is not intended to create, and the information contained herein does not constitute, an attorney-client relationship. No recommendation or advice is being given as to whether any investment or strategy is suitable for a particular investor. It should not be assumed that any investments in securities, companies, sectors or markets identified and described were or will be profitable. All information is current as of the date of herein and is subject to change without notice. Any views or opinions expressed may not reflect those of the firm as a whole.

Any projections, targets, or estimates in this report are forward looking statements and are based on the firm’s research, analysis, and assumptions. Due to rapidly changing market conditions and the complexity of investment decisions, supplemental information and other sources may be required to make informed investment decisions based on your individual investment objectives and suitability specifications. All expressions of opinions are subject to change without notice. Clients should seek financial advice regarding the appropriateness of investing in any security or investment strategy discussed in this presentation.

Certain economic and market information contained herein has been obtained from published sources prepared by other parties. Zacks Investment Management does not assume any responsibility for the accuracy or completeness of such information. Further, no third party has assumed responsibility for independently verifying the information contained herein and accordingly no such persons make any representations with respect to the accuracy, completeness or reasonableness of the information provided herein. Unless otherwise indicated, market analysis and conclusions are based upon opinions or assumptions that Zacks Investment Management considers to be reasonable. Any investment inherently involves a high degree of risk, beyond any specific risks discussed herein.

The S&P 500 Index is a well-known, unmanaged index of the prices of 500 large-company common stocks, mainly bluechip stocks, selected by Standard & Poor’s. The S&P 500 Index assumes reinvestment of dividends but does not reflect advisory fees. The volatility of the benchmark may be materially different from the individual performance obtained by a specific investor. An investor cannot invest directly in an index. The Russell 1000 Growth Index is a well-known, unmanaged index of the prices of 1000 large-company growth common stocks selected by Russell.

The Russell 1000 Growth Index assumes reinvestment of dividends but does not reflect advisory fees. An investor cannot invest directly in an index. The volatility of the benchmark may be materially different from the individual performance obtained by a specific investor.

Nasdaq Composite Index is the market capitalization-weighted index of over 3,300 common equities listed on the Nasdaq stock exchange. The types of securities in the index include American depositary receipts, common stocks, real estate investment trusts (REITs) and tracking stocks, as well as limited partnership interests. The index includes all Nasdaqlisted stocks that are not derivatives, preferred shares, funds, exchange-traded funds (ETFs) or debenture securities. An investor cannot invest directly in an index. The volatility of the benchmark may be materially different from the individual performance obtained by a specific investor.

The Dow Jones Industrial Average measures the daily stock market movements of 30 U.S. publicly-traded companies listed on the NASDAQ or the New York Stock Exchange (NYSE). The 30 publicly-owned companies are considered leaders in the United States economy. An investor cannot directly invest in an index. The volatility of the benchmark may be materially different from the individual performance obtained by a specific investor.

The Russell 2000 Index is a well-known, unmanaged index of the prices of 2000 small-cap company common stocks, selected by Russell. The Russell 2000 Index assumes reinvestment of dividends but does not reflect advisory fees. An investor cannot invest directly in an index. The volatility of the benchmark may be materially different from the individual performance obtained by a specific investor.

The S&P Mid Cap 400 provides investors with a benchmark for mid-sized companies. The index, which is distinct from the large-cap S&P 500, is designed to measure the performance of 400 mid-sized companies, reflecting the distinctive risk and return characteristics of this market segment.

The S&P GSCI is the first major investable commodity index. It is one of the most widely recognized benchmarks that is broad-based and production weighted to represent the global commodity market beta. The index is designed to be investable by including the most liquid commodity futures, and provides diversification with low correlations to other asset classes. The volatility of the benchmark may be materially different from the individual performance obtained by a specific investor.

The Russell 1000 Value Index is a well-known, unmanaged index of the prices of 1000 large-company value common stocks selected by Russell. The Russell 1000 Value Index assumes reinvestment of dividends but does not reflect advisory fees. An investor cannot directly invest in an index. The volatility of the benchmark may be materially different from the individual performance obtained by a specific investor.

The Nikkei Stock Average, the Nikkei 225 is used around the globe as the premier index of Japanese stocks. More than 60 years have passed since the commencement of its calculation, which represents the history of Japanese economy after the World War II. Because of the prominent nature of the index, many financial products linked to the Nikkei 225 have been created are traded worldwide while the index has been sufficiently used as the indicator of the movement of Japanese stock markets.

The Nikkei 225 is a price-weighted equity index, which consists of 225 stocks in the 1st section of the Tokyo Stock Exchange. The volatility of the benchmark may be materially different from the individual performance obtained by a specific investor.

The CBOE Volatility Index (VIX) is a calculation designed to produce a measure of constant, 30-day expected volatility of the U.S. stock market, derived from real-time, mid-quote prices of S&P 500 Index call and put options. On a global basis, it is one of the most recognized measures of volatility — widely reported by financial media and closely followed by a variety of market participants as a daily market indicator. The volatility of the benchmark may be materially different from the individual performance obtained by a specific investor. An investor cannot invest directly in an index.

Mitch Zacks – Stock Market Outlook Report – January 2026

By Weekly Market Commentary

Apart from the sharp selloff tied to the “Liberation Day” tariff announcement, U.S. stocks posted a banner year in 2025—largely driven by Technology stocks and the ongoing AI trade.

The strong performance has many investors concerned. The phrase “AI bubble” made the rounds in the second half of last year, with comparisons to the late 1990s tech boom becoming increasingly common. It’s a fair position to bring up for debate—valuations are elevated, enthusiasm is widespread, and capital spending tied to artificial intelligence is accelerating.1 Market bubbles happen when asset prices become untethered from underlying fundamentals, and importantly, from free cash flow. So the question for investors today is, have we reached that point in this cycle? To answer that question, it is useful to look back to the late 1990s to understand what other forces were at work in creating bubble-like conditions. In that period, we saw soaring valuations like we do now, but those valuations were also accompanied by dramatic economy-wide distortions: an unprecedented investment surge, declining corporate profitability, rising leverage, widening credit spreads, and growing financial imbalances that eventually helped tip the economy into recession.

In our view, many of those warning signs are not yet visible today, but it’s important for investors to continue to look for them. Let’s start with the investment piece. Capital expenditures (business investment) from hyper-scalers have surged since generative AI went mainstream in late 2022, and AI-related investment is now a key component of total investment across the economy. But the scale and persistence of that spending remain well below what defined the late stages of the tech bubble. Relative to GDP, AI investment is smaller than the telecom and technology buildout of the late 1990s, and it has not yet been sustained for the multi-year stretch that ultimately proved destabilizing back then.

Profitability also tells an important story. In the 1990s, corporate profit margins peaked in late 1997 (see chart below) and then quietly eroded as wages rose and unit labor costs climbed. As corporate profitability fell, the Nasdaq continued to soar. Today, the opposite dynamic is in place. Corporate margins remain elevated, earnings growth has been resilient, and wage pressures have eased rather than intensified. Productivity growth has improved recently, though it is still too early to attribute most of that gain directly to AI. Crucially, there is no clear evidence yet that AI-related investment is undermining profitability at the macro level, as seen on the chart below.

Balance sheets further differentiate this cycle from the last one. During the tech bubble, investment increasingly relied on debt, pushing the corporate sector into financial deficit and weakening balance sheets. Today, most large AI-linked companies are funding expansion primarily through internal cash flows. Leverage has risen modestly, but from historically strong starting points, and the corporate sector as a whole remains in surplus.

Download Full Stock Market Report

1 Haver Analytics, Goldman Sachs Global Investment Research, November 9, 2025.

2 Fred Economic Data. December 23, 2025. https://fred.stlouisfed.org/series/A446RC1Q027SBEA

DISCLOSURE

Past performance is no guarantee of future results. Inherent in any investment is the potential for loss.

Zacks Investment Management, Inc. is a wholly-owned subsidiary of Zacks Investment Research. Zacks Investment Management is an independent Registered Investment Advisory firm and acts as an investment manager for individuals and institutions. Zacks Investment Research is a provider of earnings data and other financial data to institutions and to individuals.

This material is being provided for informational purposes only and nothing herein constitutes investment, legal, accounting or tax advice, or a recommendation to buy, sell or hold a security. Do not act or rely upon the information and advice given in this publication without seeking the services of competent and professional legal, tax, or accounting counsel. Publication and distribution of this article is not intended to create, and the information contained herein does not constitute, an attorney-client relationship. No recommendation or advice is being given as to whether any investment or strategy is suitable for a particular investor. It should not be assumed that any investments in securities, companies, sectors or markets identified and described were or will be profitable. All information is current as of the date of herein and is subject to change without notice. Any views or opinions expressed may not reflect those of the firm as a whole.

Any projections, targets, or estimates in this report are forward looking statements and are based on the firm’s research, analysis, and assumptions. Due to rapidly changing market conditions and the complexity of investment decisions, supplemental information and other sources may be required to make informed investment decisions based on your individual investment objectives and suitability specifications. All expressions of opinions are subject to change without notice. Clients should seek financial advice regarding the appropriateness of investing in any security or investment strategy discussed in this presentation.

Certain economic and market information contained herein has been obtained from published sources prepared by other parties. Zacks Investment Management does not assume any responsibility for the accuracy or completeness of such information. Further, no third party has assumed responsibility for independently verifying the information contained herein and accordingly no such persons make any representations with respect to the accuracy, completeness or reasonableness of the information provided herein. Unless otherwise indicated, market analysis and conclusions are based upon opinions or assumptions that Zacks Investment Management considers to be reasonable. Any investment inherently involves a high degree of risk, beyond any specific risks discussed herein.

The S&P 500 Index is a well-known, unmanaged index of the prices of 500 large-company common stocks, mainly blue-chip stocks, selected by Standard & Poor’s. The volatility of the benchmark may be materially different from the individual performance obtained by a specific investor. An investor cannot invest directly in an index. The S&P 500 Index assumes reinvestment of dividends but does not reflect advisory fees. The Russell 1000 Growth Index is a well-known, unmanaged index of the prices of 1000 large-company growth common stocks selected by Russell.

The Russell 1000 Growth Index assumes reinvestment of dividends but does not reflect advisory fees. An investor cannot invest directly in an index. The volatility of the benchmark may be materially different from the individual performance obtained by a specific investor.

Nasdaq Composite Index is the market capitalization-weighted index of over 3,300 common equities listed on the Nasdaq stock exchange. The types of securities in the index include American depositary receipts, common stocks, real estate investment trusts (REITs) and tracking stocks, as well as limited partnership interests. The index includes all Nasdaq-listed stocks that are not derivatives, preferred shares, funds, exchange-traded funds (ETFs) or debenture securities. An investor cannot invest directly in an index. The volatility of the benchmark may be materially different from the individual performance obtained by a specific investor.

The Dow Jones Industrial Average measures the daily stock market movements of 30 U.S. publicly-traded companies listed on the NASDAQ or the New York Stock Exchange (NYSE). The 30 publicly-owned companies are considered leaders in the United States economy. An investor cannot directly invest in an index. The volatility of the benchmark may be materially different from the individual performance obtained by a specific investor.

The Russell 2000 Index is a well-known, unmanaged index of the prices of 2000 small-cap company common stocks, selected by Russell. The Russell 2000 Index assumes reinvestment of dividends but does not reflect advisory fees. An investor cannot invest directly in an index. The volatility of the benchmark may be materially different from the individual performance obtained by a specific investor.

The FTSE 100 is a market-capitalisation weighted index of UK-listed blue chip companies. The index is part of the FTSE UK Series and is designed to measure the performance of the 100 largest companies traded on the London Stock Exchange that pass screening for size and liquidity. FTSE 100 constituents are all traded on the London Stock Exchange’s SETS trading system. An investor cannot invest directly in an index. The volatility of the benchmark may be materially different from the individual performance obtained by a specific investor.

The Nikkei Stock Average, the Nikkei 225 is used around the globe as the premier index of Japanese stocks. More than 60 years have passed since the commencement of its calculation, which represents the history of Japanese economy after the World War II. Because of the prominent nature of the index, many financial products linked to the Nikkei 225 have been created are traded worldwide while the index has been sufficiently used as the indicator of the movement of Japanese stock markets. The Nikkei 225 is a price-weighted equity index, which consists of 225 stocks in the 1st section of the Tokyo Stock Exchange. An investor cannot invest directly in an index. The volatility of the benchmark may be materially different from the individual performance obtained by a specific investor.

The Russell 1000 Value Index is a well-known, unmanaged index of the prices of 1000 large-company value common stocks selected by Russell. The Russell 1000 Value Index assumes reinvestment of dividends but does not reflect advisory fees. An investor cannot directly invest in an index. The volatility of the benchmark may be materially different from the individual performance obtained by a specific investor.

The Russell Midcap Index is a well-known, unmanaged index of the prices of approximately 800 mid-cap company common stocks, selected by Russell. The Russell Midcap Index assumes reinvestment of dividends but does not reflect advisory fees. An investor cannot invest directly in an index. The volatility of the benchmark may be materially different from the individual performance obtained by a specific investor.

DAX tracks the performance of the 40 largest companies listed on the Regulated Market of Frankfurter Wertpapierbörse (FWB, the Frankfurt Stock Exchange) that fulfil certain minimum quality and profitability requirements. Constituent selection is based on free float market capitalization. An investor cannot invest directly in an index.

The S&P Municipal Bond Index is a broad, market value-weighted index that seeks to measure the performance of the U.S. municipal bond market. An investor cannot invest directly in an index. The MSCI Emerging Markets Index captures large and mid cap representation across 24 Emerging Markets (EM) countries. The index covers approximately 85% of the free float-adjusted market capitalization in each country. An investor cannot invest directly in an index.

The S&P MidCap 400 provides investors with a benchmark for mid-sized companies. The index, which is distinct from the large-cap S&P 500, is designed to measure the performance of 400 mid-sized companies, reflecting the distinctive risk and return characteristics of this market segment. An investor cannot invest directly in an index. The volatility of the benchmark may be materially different from the individual performance obtained by a specific investor.

The S&P SmallCap 600 seeks to measure the small-cap segment of the U.S. equity market. The index is designed to track companies that meet specific inclusion criteria to ensure that they are liquid and financially viable. The volatility of the benchmark may be materially different from the individual performance obtained by a specific investor.

The CBOE Volatility Index (VIX) is a calculation designed to produce a measure of constant, 30-day expected volatility of the U.S. stock market, derived from real-time, mid-quote prices of S&P 500 Index call and put options. On a global basis, it is one of the most recognized measures of volatility — widely reported by financial media and closely followed by a variety of market participants as a daily market indicator. The volatility of the benchmark may be materially different from the individual performance obtained by a specific investor. An investor cannot invest directly in an index.

The S&P SmallCap 600 Value measures constituents from the S&P SmallCap 600 that are classified as value stocks based on three factors: the ratios of book value, earnings and sales to price. An investor cannot invest directly in an index.

The S&P SmallCap 600 Growth measures constituents from the S&P SmallCap 600 that are classified as growth stocks based on three factors: sales growth, the ratio of earnings change to price, and momentum. An investor cannot invest directly in an index. The Russell 2000 Value Index measures the performance of the smallcap value segment of the US equity universe. It includes those Russell 2000 companies with relatively lower price-to-book ratios, lower I/B/E/S forecast medium term (2 year) growth and lower sales per share historical growth (5 years).

The Russell 2000 Value Index is constructed to provide a comprehensive and unbiased barometer for the small-cap value segment. The index is completely reconstituted annually to ensure new and growing equities are included and that the represented companies continue to reflect value characteristics. The volatility of the benchmark may be materially different from the individual performance obtained by a specific investor.

The Russell 2000 Growth Index measures the performance of the smallcap growth segment of the US equity universe. It includes those Russell 2000 companies with relatively higher price-to-book ratios, higher I/B/E/S forecast medium term (2 year) growth and higher sales per share historical growth (5 years). The Russell 2000 Growth Index is constructed to provide a comprehensive and unbiased barometer for the small-cap growth segment. The index is completely reconstituted annually to ensure new and growing equities are included and that the represented companies continue to reflect growth characteristics. The volatility of the benchmark may be materially different from the individual performance obtained by a specific investor.

The MSCI United Kingdom Index is designed to measure the performance of the large and mid-cap segments of the UK market. The index covers approximately 85% of the free float-adjusted market capitalization in the UK. The volatility of the benchmark may be materially different from the individual performance obtained by a specific investor.

The MSCI Germany Index is designed to measure the performance of the large and mid-cap segments of the German market. The index covers about 85% of the equity universe in Germany. The volatility of the benchmark may be materially different from the individual performance obtained by a specific investor.

The MSCI Japan Index is designed to measure the performance of the large and mid-cap segments of the Japanese market. The index covers approximately 85% of the free float-adjusted market capitalization in Japan. The volatility of the benchmark may be materially different from the individual performance obtained by a specific investor.

The MSCI World Index captures large and mid-cap representation across 23 Developed Markets (DM) countries. The index covers approximately 85% of the free float-adjusted market capitalization in each country. The volatility of the benchmark may be materially different from the individual performance obtained by a specific investor.

The MSCI EAFE Index is an equity index which captures large and mid cap representation across 21 Developed Markets countries around the world, excluding the US and Canada. The index covers approximately 85% of the free float-adjusted market capitalization in each country. The volatility of the benchmark may be materially different from the individual performance obtained by a specific investor. An investor cannot invest directly in an index.

Mitch Zacks – Weekly Market Commentary: “Buying the Dip” is a Flawed Long-Term Investment Strategy

By Weekly Market Commentary

Stocks have been on a roll over the past few years, with high double-digit returns from 2023 through the end of last year. But strong performance also has many investors concerned, especially those with extra cash on the sidelines. With elevated valuations and noisy headlines, I often hear investors say: “At these levels, I’d rather wait for a pullback before investing.”

In stock market parlance, this approach is commonly referred to as “buying the dip.” But recent quantitative research shows that such a strategy is flawed, and it can actually hurt investor returns over time.

To be fair, I understand the appeal of a ‘buying the dip’ approach. By waiting for markets to pull back, investors hope to capitalize by buying at a better entry point. It makes sense. But the issue is that historically, markets do not offer these types of opportunities as often as investors might think they do. Indeed, equities spend far more time near highs than in deep or prolonged drawdowns, and when pullbacks do occur, they tend to be short, sharp, and unpredictable. They also tend to follow strong rallies, which “buy-the-dip” investors often end up sitting out.

New quantitative research puts this all in perspective.

A recent study1 tested nearly 200 different “buy the dip” rule sets across long market histories. The findings: more than 60% of the strategies produced worse risk-adjusted outcomes (expressed as a Sharpe ratio) than buy-and-hold strategies. The shortfall wasn’t trivial: across the full sample, the average Sharpe ratio for dip-buying strategies was about 0.04 lower than buy-and-hold.

Notably, the results were even less forgiving in the modern era. Using a post-1989 sample through late 2025, the same research found the average dip-buying strategy delivered a Sharpe ratio about 0.27 lower than staying invested, roughly cutting the dip-buying strategy’s risk-adjusted effectiveness nearly in half. Put another way, over the past 35 years, systematically “buying the dip” created more risk for less return. Most investors don’t want that.

Why did the dip-buying strategies often underperform? Because of the structural cost of waiting.

Dip-buying strategies require investors to sit in cash while markets move. During strong periods, equities compound returns through earnings growth and reinvestment, while cash earns little by comparison. Missing even a handful of strong days can have a meaningful impact on long-term outcomes, particularly when earnings growth remains robust, as it did in 2025. As seen in the chart below, missing even just the 10 best days in the market over a long stretch can seriously impact returns to the downside.

For investors who might be waiting to “buy the dip” today, it’s important to reckon with the fact that earnings growth remains strong, while fiscal and monetary policy are factoring as tailwinds. Stocks are due for a pullback, sure. But how much longer could stocks potentially rally before that meaningful correction arrives? That brings up the question of opportunity cost, which “buy the dip” investors must consider.

Remember, waiting for a pullback is not a neutral decision. It is a timing call, and it’s one that history suggests is very difficult to execute successfully. What tends to work better than waiting for the perfect entry is participation with discipline. Dollar-cost averaging can reduce timing risk, while diversification and rebalancing allow investors to manage valuation concerns without stepping entirely to the sidelines. These approaches acknowledge the uncertainty without requiring precision or perfection.

Bottom Line for Investors

I do not want to dismiss investor concerns about valuation. The S&P 500 index trades near 22 times forward earnings, which is close to recent cycle highs. But valuation alone rarely determines short- or intermediate-term returns. In 2025, earnings growth was the primary driver of stock market returns, with roughly two-thirds of the S&P 500’s total return coming from earnings growth. The remainder was split between dividends and only modest changes in valuation multiples. Another strong year for corporate earnings could deliver a similar result.

At the end of the day, in environments where fundamentals remain supportive, the cost of waiting often outweighs the benefit of buying slightly lower—which again, is very difficult to execute.

1 AQR. 2025. https://advisor.zacksim.com/e/376582/ernative-Thinking-Hold-the-Dip/5v2174/1441912980/h/rVHo_N8aURIj0_1HQaqWyx2BKqSk_mdfwJanN_IynG8

DISCLOSURE
Past performance is no guarantee of future results. Inherent in any investment is the potential for loss.

Zacks Investment Management, Inc. is a wholly-owned subsidiary of Zacks Investment Research. Zacks Investment Management is an independent Registered Investment Advisory firm and acts as an investment manager for individuals and institutions. Zacks Investment Research is a provider of earnings data and other financial data to institutions and to individuals.

This material is being provided for informational purposes only and nothing herein constitutes investment, legal, accounting or tax advice, or a recommendation to buy, sell or hold a security. Do not act or rely upon the information and advice given in this publication without seeking the services of competent and professional legal, tax, or accounting counsel. Publication and distribution of this article is not intended to create, and the information contained herein does not constitute, an attorney-client relationship. No recommendation or advice is being given as to whether any investment or strategy is suitable for a particular investor. It should not be assumed that any investments in securities, companies, sectors or markets identified and described were or will be profitable. All information is current as of the date of herein and is subject to change without notice. Any views or opinions expressed may not reflect those of the firm as a whole.

Any projections, targets, or estimates in this report are forward looking statements and are based on the firm’s research, analysis, and assumptions. Due to rapidly changing market conditions and the complexity of investment decisions, supplemental information and other sources may be required to make informed investment decisions based on your individual investment objectives and suitability specifications. All expressions of opinions are subject to change without notice. Clients should seek financial advice regarding the appropriateness of investing in any security or investment strategy discussed in this presentation.

Certain economic and market information contained herein has been obtained from published sources prepared by other parties.  Zacks Investment Management does not assume any responsibility for the accuracy or completeness of such information. Further, no third party has assumed responsibility for independently verifying the information contained herein and accordingly no such persons make any representations with respect to the accuracy, completeness or reasonableness of the information provided herein. Unless otherwise indicated, market analysis and conclusions are based upon opinions or assumptions that Zacks Investment Management considers to be reasonable. Any investment inherently involves a high degree of risk, beyond any specific risks discussed herein.

The S&P 500 Index is a well-known, unmanaged index of the prices of 500 large-company common stocks, mainly blue-chip stocks, selected by Standard & Poor’s. The S&P 500 Index assumes reinvestment of dividends but does not reflect advisory fees. The volatility of the benchmark may be materially different from the individual performance obtained by a specific investor. An investor cannot invest directly in an index.

The Russell 1000 Growth Index is a well-known, unmanaged index of the prices of 1000 large-company growth common stocks selected by Russell. The Russell 1000 Growth Index assumes reinvestment of dividends but does not reflect advisory fees. An investor cannot invest directly in an index. The volatility of the benchmark may be materially different from the individual performance obtained by a specific investor.

Nasdaq Composite Index is the market capitalization-weighted index of over 3,300 common equities listed on the Nasdaq stock exchange. The types of securities in the index include American depositary receipts, common stocks, real estate investment trusts (REITs) and tracking stocks, as well as limited partnership interests. The index includes all Nasdaq-listed stocks that are not derivatives, preferred shares, funds, exchange-traded funds (ETFs) or debenture securities. An investor cannot invest directly in an index. The volatility of the benchmark may be materially different from the individual performance obtained by a specific investor.

The Dow Jones Industrial Average measures the daily stock market movements of 30 U.S. publicly-traded companies listed on the NASDAQ or the New York Stock Exchange (NYSE). The 30 publicly-owned companies are considered leaders in the United States economy. An investor cannot directly invest in an index.  The volatility of the benchmark may be materially different from the individual performance obtained by a specific investor.

The Bloomberg Global Aggregate Index is a flagship measure of global investment grade debt from twenty-four local currency markets. This multi-currency benchmark includes treasury, government-related, corporate and securitized fixed-rate bonds from both developed and emerging markets issuers. An investor cannot invest directly in an index. The volatility of the benchmark may be materially different from the individual performance obtained by a specific investor.

The ICE Exchange-Listed Fixed & Adjustable Rate Preferred Securities Index is a modified market capitalization weighted index composed of preferred stock and securities that are functionally equivalent to preferred stock including, but not limited to, depositary preferred securities, perpetual subordinated debt and certain securities issued by banks and other financial institutions that are eligible for capital treatment with respect to such instruments akin to that received for issuance of straight preferred stock. An investor cannot invest directly in an index. The volatility of the benchmark may be materially different from the individual performance obtained by a specific investor.

The MSCI ACWI ex U.S. Index captures large and mid-cap representation across 22 of 23 Developed Markets (DM) countries (excluding the United States) and 24 Emerging Markets (EM) countries. The index covers approximately 85% of the global equity opportunity set outside the U.S. An investor cannot invest directly in an index. The volatility of the benchmark may be materially different from the individual performance obtained by a specific investor.

The Russell 2000 Index is a well-known, unmanaged index of the prices of 2000 small-cap company common stocks, selected by Russell. The Russell 2000 Index assumes reinvestment of dividends but does not reflect advisory fees. An investor cannot invest directly in an index. The volatility of the benchmark may be materially different from the individual performance obtained by a specific investor.

The S&P Mid Cap 400 provides investors with a benchmark for mid-sized companies. The index, which is distinct from the large-cap S&P 500, is designed to measure the performance of 400 mid-sized companies, reflecting the distinctive risk and return characteristics of this market segment.

The S&P 500 Pure Value index is a style-concentrated index designed to track the performance of stocks that exhibit the strongest value characteristics by using a style-attractiveness-weighting scheme. An investor cannot directly invest in an index.  The volatility of the benchmark may be materially different from the individual performance obtained by a specific investor.

Mitch Zacks – Weekly Market Commentary: How Investors React to Headlines is the Biggest Risk

By Weekly Market Commentary

The start of the year has brought no shortage of headlines. Developments in Venezuela, renewed debate around Federal Reserve independence, rising rhetoric involving Iran, and ongoing discussions around domestic policy have kept the news cycle busy. For many investors, it can feel like a lot to process.

But it’s worth remembering that markets do not become unsettled simply because the news is active. Markets have always operated alongside geopolitical tension, policy debate, and political change. What matters more is whether those developments meaningfully alter the outlook for economic growth, corporate earnings, or financial conditions.

And so far, the evidence suggests the broader expansion remains intact as we look toward 2026.

In fact, noisy news cycles often serve as a useful reminder of how resilient markets can be. Uncertainty does not automatically translate into poor outcomes, and history shows that investors who remain focused on fundamentals tend to fare better than those who allow headlines to drive decisions.

Last year provided a timely example. The market’s selloff near the end of the first quarter was steep and sudden, particularly following the April 2 “Liberation Day” tariff announcement. Sentiment deteriorated quickly as investors attempted to price in worst-case scenarios. At the time, I urged patience and cautioned against knee-jerk reactions. Within roughly twelve weeks, the S&P 500 had recovered and moved back to all-time highs. The episode reminded us that headline-driven pullbacks can happen quickly, but so can recoveries when fundamentals remain sound.

That experience also highlights why investor behavior matters most during active news cycles. Headlines can temporarily pull attention away from earnings, growth, and positive fundamentals, creating openings for emotional responses that aren’t always aligned with long-term goals. The challenge isn’t staying informed—it’s staying disciplined.

One common pitfall is recency and availability bias, which is the tendency to overweight what is most recent or emotionally charged. When a specific event dominates coverage, it can feel disproportionately important to markets even when its economic footprint is relatively small. Venezuela is a good illustration. While the situation is complex and evolving, the country represents a tiny share of global economic output; any potential effects on global oil markets would likely take years to materialize, not months. Markets tend to recognize quickly that scale matters more than narratives.

Confirmation bias can also creep in during periods of policy debate. Investors naturally gravitate toward narratives that reinforce their existing views, treating headlines as validation rather than data points to be weighed objectively. The discussion around Federal Reserve independence is a case in point. While the debate has drawn attention, markets have historically focused less on commentary and more on institutional credibility, policy transmission, and economic outcomes. Separating narrative from impact remains essential.

Then there is action bias, which is when investors equate “doing something” with positive progress. In fast-moving environments, trading can feel like regaining control. But excessive, emotionally driven activity has long been one of the most consistent drags on returns. Successful investing often means allowing a well-constructed strategy to work, rather than trying to respond to every development along the way.

What tends to serve investors best in moments like this is not predicting the next headline, but reaffirming their long-term plan. Remember, markets do not require calm conditions to function, and perfect foresight has never been a prerequisite for success. Over time, markets have rewarded investors who remain invested, maintain perspective, and avoid letting emotions dictate strategy.

Bottom Line for Investors

Periods of heightened uncertainty are not necessarily periods of heightened risk.

More often, noisy news cycles are remembered as moments when investor behavior plays a larger role in determining outcomes. Today’s headlines—whether geopolitical, monetary, or political—may feel prominent, but markets ultimately respond to earnings, growth, and fundamentals. As last year’s tariff-driven volatility demonstrated, markets can adapt to new information far faster than emotions can recalibrate.

Maintaining discipline, sticking to a plan, and staying focused on what truly drives long-term returns remain among the most effective ways for investors to navigate any environment, including the current one.

BEA. 2025. https://advisor.zacksim.com/e/376582/-files-2025-12-gdp3q25-ini-pdf/5v183t/1436327421/h/N69zY3FcAZk7lWfLtCPDsNYah7NrxAbYE-6zvnFYnFc

DISCLOSURE
Past performance is no guarantee of future results. Inherent in any investment is the potential for loss.

Zacks Investment Management, Inc. is a wholly-owned subsidiary of Zacks Investment Research. Zacks Investment Management is an independent Registered Investment Advisory firm and acts as an investment manager for individuals and institutions. Zacks Investment Research is a provider of earnings data and other financial data to institutions and to individuals.

This material is being provided for informational purposes only and nothing herein constitutes investment, legal, accounting or tax advice, or a recommendation to buy, sell or hold a security. Do not act or rely upon the information and advice given in this publication without seeking the services of competent and professional legal, tax, or accounting counsel. Publication and distribution of this article is not intended to create, and the information contained herein does not constitute, an attorney-client relationship. No recommendation or advice is being given as to whether any investment or strategy is suitable for a particular investor. It should not be assumed that any investments in securities, companies, sectors or markets identified and described were or will be profitable. All information is current as of the date of herein and is subject to change without notice. Any views or opinions expressed may not reflect those of the firm as a whole.

Any projections, targets, or estimates in this report are forward looking statements and are based on the firm’s research, analysis, and assumptions. Due to rapidly changing market conditions and the complexity of investment decisions, supplemental information and other sources may be required to make informed investment decisions based on your individual investment objectives and suitability specifications. All expressions of opinions are subject to change without notice. Clients should seek financial advice regarding the appropriateness of investing in any security or investment strategy discussed in this presentation.

Certain economic and market information contained herein has been obtained from published sources prepared by other parties.  Zacks Investment Management does not assume any responsibility for the accuracy or completeness of such information. Further, no third party has assumed responsibility for independently verifying the information contained herein and accordingly no such persons make any representations with respect to the accuracy, completeness or reasonableness of the information provided herein. Unless otherwise indicated, market analysis and conclusions are based upon opinions or assumptions that Zacks Investment Management considers to be reasonable. Any investment inherently involves a high degree of risk, beyond any specific risks discussed herein.

The S&P 500 Index is a well-known, unmanaged index of the prices of 500 large-company common stocks, mainly blue-chip stocks, selected by Standard & Poor’s. The S&P 500 Index assumes reinvestment of dividends but does not reflect advisory fees. The volatility of the benchmark may be materially different from the individual performance obtained by a specific investor. An investor cannot invest directly in an index.

The Russell 1000 Growth Index is a well-known, unmanaged index of the prices of 1000 large-company growth common stocks selected by Russell. The Russell 1000 Growth Index assumes reinvestment of dividends but does not reflect advisory fees. An investor cannot invest directly in an index. The volatility of the benchmark may be materially different from the individual performance obtained by a specific investor.

Nasdaq Composite Index is the market capitalization-weighted index of over 3,300 common equities listed on the Nasdaq stock exchange. The types of securities in the index include American depositary receipts, common stocks, real estate investment trusts (REITs) and tracking stocks, as well as limited partnership interests. The index includes all Nasdaq-listed stocks that are not derivatives, preferred shares, funds, exchange-traded funds (ETFs) or debenture securities. An investor cannot invest directly in an index. The volatility of the benchmark may be materially different from the individual performance obtained by a specific investor.

The Dow Jones Industrial Average measures the daily stock market movements of 30 U.S. publicly-traded companies listed on the NASDAQ or the New York Stock Exchange (NYSE). The 30 publicly-owned companies are considered leaders in the United States economy. An investor cannot directly invest in an index.  The volatility of the benchmark may be materially different from the individual performance obtained by a specific investor.

The Bloomberg Global Aggregate Index is a flagship measure of global investment grade debt from twenty-four local currency markets. This multi-currency benchmark includes treasury, government-related, corporate and securitized fixed-rate bonds from both developed and emerging markets issuers. An investor cannot invest directly in an index. The volatility of the benchmark may be materially different from the individual performance obtained by a specific investor.

The ICE Exchange-Listed Fixed & Adjustable Rate Preferred Securities Index is a modified market capitalization weighted index composed of preferred stock and securities that are functionally equivalent to preferred stock including, but not limited to, depositary preferred securities, perpetual subordinated debt and certain securities issued by banks and other financial institutions that are eligible for capital treatment with respect to such instruments akin to that received for issuance of straight preferred stock. An investor cannot invest directly in an index. The volatility of the benchmark may be materially different from the individual performance obtained by a specific investor.

The MSCI ACWI ex U.S. Index captures large and mid-cap representation across 22 of 23 Developed Markets (DM) countries (excluding the United States) and 24 Emerging Markets (EM) countries. The index covers approximately 85% of the global equity opportunity set outside the U.S. An investor cannot invest directly in an index. The volatility of the benchmark may be materially different from the individual performance obtained by a specific investor.

The Russell 2000 Index is a well-known, unmanaged index of the prices of 2000 small-cap company common stocks, selected by Russell. The Russell 2000 Index assumes reinvestment of dividends but does not reflect advisory fees. An investor cannot invest directly in an index. The volatility of the benchmark may be materially different from the individual performance obtained by a specific investor.

The S&P Mid Cap 400 provides investors with a benchmark for mid-sized companies. The index, which is distinct from the large-cap S&P 500, is designed to measure the performance of 400 mid-sized companies, reflecting the distinctive risk and return characteristics of this market segment.

The S&P 500 Pure Value index is a style-concentrated index designed to track the performance of stocks that exhibit the strongest value characteristics by using a style-attractiveness-weighting scheme. An investor cannot directly invest in an index.  The volatility of the benchmark may be materially different from the individual performance obtained by a specific investor.

Mitch Zacks – Weekly Market Commentary: U.S. GDP Growth Looks Strong, But Here’s What Matters More

By Weekly Market Commentary

The latest U.S. GDP numbers brought a ‘wow’ factor with them.

At the headline level, the number was by all accounts impressive. Real GDP grew at a 4.3% annualized pace in Q3 2025, up from 3.8% in the second quarter and well above expectations that growth would decelerate to 3%. On its face, the economy clearly regained some momentum.

For investors, though, the read on GDP data lies less in the headline and more in the details beneath the surface. You must also remember that markets priced-in the growth long ago, so the print is more about confirming last year’s market strength being grounded in solid fundamentals. There are also signposts in the data that can tell us what to look for in 2026.1

The clearest area of strength remains the consumer. Personal consumption expenditures grew at a 3.5% annualized rate in the third quarter, up from 2.5% in Q2 and just 0.6% in Q1. Given that consumer spending accounts for roughly 68% of U.S. GDP, this acceleration did much of the heavy lifting for headline growth. That’s a critical point, as it reinforces the view that households have remained willing and able to spend despite policy uncertainty.

Business investment is the factor I think investors should focus on the most heading into the new year. Nonresidential fixed investment slowed to a 2.8% annualized pace in Q3, down from 7.3% in the prior quarter. Residential investment declined for a second consecutive quarter, falling 5.1%. Together, these figures offer a different narrative than the one we see with U.S. households in aggregate. Companies are not pulling back aggressively, but they are also not leaning into expansion. Whether this slowdown in investment proves temporary or persistent will be an important signal as 2026 begins.

Government spending also contributed to Q3 growth, adding roughly 0.4% to the headline figure. That increase was driven largely by national defense spending and state and local outlay, the former of which could be a meaningful factor in 2026. Military expenditures rarely move in isolation, and they often coincide with heightened uncertainty elsewhere in the global system.

Enter the Venezuela issue. There is plenty of commentary circulating about the geopolitical and energy market impacts, but I’d like to set those aside for now to focus on the broad market perspective, where scale is the key factor to focus on. Venezuela represents roughly 0.07% of global GDP and produces less than 1% of the global oil supply. While leadership changes and geopolitical developments there warrant monitoring, any meaningful shifts in production, investment, or trade would take years to materialize—not quarters.

For investors, that timeframe is important. Markets tend to react quickly to uncertainty surrounding regional conflict, but they also tend to move on just as quickly once the economic footprint becomes clear. Put another way, geopolitical events can influence short-term sentiment, but they rarely alter the core economic inputs that matter most for markets over the next year (growth, earnings, interest rate policy, and capital allocation).

Which brings me to the final component of the GDP report that stood out: trade. Exports rose at an 8.8% annualized pace, adding roughly 0.9% to GDP, while imports declined—pushing net trade’s contribution to about 1.6%. In Q1 2025, imports surged 38% as businesses ‘front-ran’ tariffs, and inventories alone added about 2.6% to growth. Since then, the process has been unwinding, with imports cooling and inventories being drawn down. In a normal cycle, falling imports could hint at softer domestic demand, so I think investors should be watching this metric closely in 2026.

Bottom Line for Investors

Taken together, the Q3 2025 GDP report paints a picture of an economy that is growing, but not accelerating uniformly beneath the surface. Strip out government spending and trade distortions, and growth in core private demand looks broadly similar to Q2 2025. That consistency helps explain why markets didn’t exhibit much volatility, up or down, in the second half of last year.

Looking ahead to 2026, three questions stand out:

  1. Does business investment rebound as policy and trade uncertainty begin to clear, or does caution persist?
  2. Do trade flows normalize as inventory dynamics settle, or do imports continue to weaken as new frictions emerge?
  3. Can consumers continue to support growth if hiring remains subdued and wage gains slow further?

How those three dynamics unfold in the early 2026 data will be key in shaping the growth outlook for the year.

Q3 2025 GDP data was released on a delayed schedule, due to the government shutdown last year.

BEA. 2025. https://advisor.zacksim.com/e/376582/-files-2025-12-gdp3q25-ini-pdf/5tz7v4/1429247784/h/9Km46p6PBv5mbSJ6bxeEkHy_I2XCMl9xzaOg-x0tt9Q

DISCLOSURE
Past performance is no guarantee of future results. Inherent in any investment is the potential for loss.

Zacks Investment Management, Inc. is a wholly-owned subsidiary of Zacks Investment Research. Zacks Investment Management is an independent Registered Investment Advisory firm and acts as an investment manager for individuals and institutions. Zacks Investment Research is a provider of earnings data and other financial data to institutions and to individuals.

This material is being provided for informational purposes only and nothing herein constitutes investment, legal, accounting or tax advice, or a recommendation to buy, sell or hold a security. Do not act or rely upon the information and advice given in this publication without seeking the services of competent and professional legal, tax, or accounting counsel. Publication and distribution of this article is not intended to create, and the information contained herein does not constitute, an attorney-client relationship. No recommendation or advice is being given as to whether any investment or strategy is suitable for a particular investor. It should not be assumed that any investments in securities, companies, sectors or markets identified and described were or will be profitable. All information is current as of the date of herein and is subject to change without notice. Any views or opinions expressed may not reflect those of the firm as a whole.

Any projections, targets, or estimates in this report are forward looking statements and are based on the firm’s research, analysis, and assumptions. Due to rapidly changing market conditions and the complexity of investment decisions, supplemental information and other sources may be required to make informed investment decisions based on your individual investment objectives and suitability specifications. All expressions of opinions are subject to change without notice. Clients should seek financial advice regarding the appropriateness of investing in any security or investment strategy discussed in this presentation.

Certain economic and market information contained herein has been obtained from published sources prepared by other parties.  Zacks Investment Management does not assume any responsibility for the accuracy or completeness of such information. Further, no third party has assumed responsibility for independently verifying the information contained herein and accordingly no such persons make any representations with respect to the accuracy, completeness or reasonableness of the information provided herein. Unless otherwise indicated, market analysis and conclusions are based upon opinions or assumptions that Zacks Investment Management considers to be reasonable. Any investment inherently involves a high degree of risk, beyond any specific risks discussed herein.

The S&P 500 Index is a well-known, unmanaged index of the prices of 500 large-company common stocks, mainly blue-chip stocks, selected by Standard & Poor’s. The S&P 500 Index assumes reinvestment of dividends but does not reflect advisory fees. The volatility of the benchmark may be materially different from the individual performance obtained by a specific investor. An investor cannot invest directly in an index.

The Russell 1000 Growth Index is a well-known, unmanaged index of the prices of 1000 large-company growth common stocks selected by Russell. The Russell 1000 Growth Index assumes reinvestment of dividends but does not reflect advisory fees. An investor cannot invest directly in an index. The volatility of the benchmark may be materially different from the individual performance obtained by a specific investor.

Nasdaq Composite Index is the market capitalization-weighted index of over 3,300 common equities listed on the Nasdaq stock exchange. The types of securities in the index include American depositary receipts, common stocks, real estate investment trusts (REITs) and tracking stocks, as well as limited partnership interests. The index includes all Nasdaq-listed stocks that are not derivatives, preferred shares, funds, exchange-traded funds (ETFs) or debenture securities. An investor cannot invest directly in an index. The volatility of the benchmark may be materially different from the individual performance obtained by a specific investor.

The Dow Jones Industrial Average measures the daily stock market movements of 30 U.S. publicly-traded companies listed on the NASDAQ or the New York Stock Exchange (NYSE). The 30 publicly-owned companies are considered leaders in the United States economy. An investor cannot directly invest in an index.  The volatility of the benchmark may be materially different from the individual performance obtained by a specific investor.

The Bloomberg Global Aggregate Index is a flagship measure of global investment grade debt from twenty-four local currency markets. This multi-currency benchmark includes treasury, government-related, corporate and securitized fixed-rate bonds from both developed and emerging markets issuers. An investor cannot invest directly in an index. The volatility of the benchmark may be materially different from the individual performance obtained by a specific investor.

The ICE Exchange-Listed Fixed & Adjustable Rate Preferred Securities Index is a modified market capitalization weighted index composed of preferred stock and securities that are functionally equivalent to preferred stock including, but not limited to, depositary preferred securities, perpetual subordinated debt and certain securities issued by banks and other financial institutions that are eligible for capital treatment with respect to such instruments akin to that received for issuance of straight preferred stock. An investor cannot invest directly in an index. The volatility of the benchmark may be materially different from the individual performance obtained by a specific investor.

The MSCI ACWI ex U.S. Index captures large and mid-cap representation across 22 of 23 Developed Markets (DM) countries (excluding the United States) and 24 Emerging Markets (EM) countries. The index covers approximately 85% of the global equity opportunity set outside the U.S. An investor cannot invest directly in an index. The volatility of the benchmark may be materially different from the individual performance obtained by a specific investor.

The Russell 2000 Index is a well-known, unmanaged index of the prices of 2000 small-cap company common stocks, selected by Russell. The Russell 2000 Index assumes reinvestment of dividends but does not reflect advisory fees. An investor cannot invest directly in an index. The volatility of the benchmark may be materially different from the individual performance obtained by a specific investor.

The S&P Mid Cap 400 provides investors with a benchmark for mid-sized companies. The index, which is distinct from the large-cap S&P 500, is designed to measure the performance of 400 mid-sized companies, reflecting the distinctive risk and return characteristics of this market segment.

The S&P 500 Pure Value index is a style-concentrated index designed to track the performance of stocks that exhibit the strongest value characteristics by using a style-attractiveness-weighting scheme. An investor cannot directly invest in an index.  The volatility of the benchmark may be materially different from the individual performance obtained by a specific investor.

Mitch Zacks – Weekly Market Commentary: Important Tax Planning Information and Insights for 2026

By Weekly Market Commentary

Tax planning in 2026 is poised to look a lot different than it did in 2025. With the passage of the One Big Beautiful Bill Act (OBBBA), provisions of the tax code are now either indexed, extended, or evolving in ways that could shape longer-term decisions for high-net-worth families, retirees, and business owners.

In my view, that makes the turn of the year a good moment to step back and assess the shifting landscape.

Before getting into planning considerations, it’s worth starting with a quick reset on where things stand. Income tax brackets continue to be adjusted for inflation, as do standard deduction amounts, meaning many households will see higher thresholds before moving into higher marginal brackets.

Source: The Wall Street Journal 1

The standard deduction has also risen meaningfully compared with pre-pandemic levels, reducing the number of taxpayers who itemize and changing the relative value of certain deductions.

For high-net-worth individuals, one of the most consequential developments involves estate and gifting rules. In 2026, the federal estate and gift tax exemption is scheduled to rise to $15 million per individual, or $30 million for married couples. These are historically elevated levels and materially expand the amount of wealth that can be transferred without triggering federal estate or gift taxes.

Charitable planning is also becoming more closely integrated with estate and income planning. For charitably inclined families, donor-advised funds (DAFs) are an increasingly tapped structure because of how they work. DAFs allow an individual to make a charitable contribution and receive the associated income tax deduction in the year of the contribution, while retaining flexibility over when grants are ultimately made to charities over time. Assets contributed to a DAF can remain invested.

For those still in their working years, higher contribution limits afford the opportunity to save more in 2026. Here are the max deferrals:

Source: Internal Revenue Service 2

High income earners also need to take note of a key change next year. Beginning in 2026, employees whose prior-year wages exceed $145,000 (indexed for inflation) will generally be required to make 401(k) catch-up contributions on a Roth basis rather than pre-tax, provided their plan offers a Roth option.

That’s a very important rule change.

This change effectively shifts tax on those catch-up dollars into the current year but allows the funds to grow and be withdrawn tax-free in retirement if the usual Roth rules are met. To note, retirement plans that do not offer Roth contributions may be unable to accept catch-up contributions for affected employees until they add that feature. For high-income earners who rely on catchups, your tax advisor can help determine whether your employer plan is prepared for this change and how to best balance pre-tax, Roth, and taxable savings given your circumstances.

Finally, small business owners also have new tax provisions to weigh. New rules affecting pass-through entities are now more durable, including the 20% qualified business income deduction. Bonus depreciation has returned to 100%, and Section 179 expense limits remain above $1 million. These provisions are best viewed as capital-allocation incentives rather than short-term tax benefits. They influence decisions around reinvestment, succession planning, and income timing, and they often overlap with personal and estate planning in ways that merit a coordinated approach.

Bottom Line for Investors

In my view, there’s plenty of unique opportunities ahead as it relates to tax planning.

Changes to brackets and deductions set the baseline, while estate exemptions, charitable structures, retirement income rules, and business incentives shape longer-term outcomes.

Wall Street Journal. October 9, 2025. https://advisor.zacksim.com/e/376582/ome-tax-brackets-2026-bbd1863d/5ty927/1420776786/h/f3n21rJfxeBrplA4XZ7tiuxLvzzfHlu1nFzXyeDNtaQ

2 IRS.gov. November 13, 2025. https://advisor.zacksim.com/e/376582/26-ira-limit-increases-to-7500/5ty921/1420776786/h/f3n21rJfxeBrplA4XZ7tiuxLvzzfHlu1nFzXyeDNtaQ

DISCLOSURE
Past performance is no guarantee of future results. Inherent in any investment is the potential for loss.

Zacks Investment Management, Inc. is a wholly-owned subsidiary of Zacks Investment Research. Zacks Investment Management is an independent Registered Investment Advisory firm and acts as an investment manager for individuals and institutions. Zacks Investment Research is a provider of earnings data and other financial data to institutions and to individuals.

This material is being provided for informational purposes only and nothing herein constitutes investment, legal, accounting or tax advice, or a recommendation to buy, sell or hold a security. Do not act or rely upon the information and advice given in this publication without seeking the services of competent and professional legal, tax, or accounting counsel. Publication and distribution of this article is not intended to create, and the information contained herein does not constitute, an attorney-client relationship. No recommendation or advice is being given as to whether any investment or strategy is suitable for a particular investor. It should not be assumed that any investments in securities, companies, sectors or markets identified and described were or will be profitable. All information is current as of the date of herein and is subject to change without notice. Any views or opinions expressed may not reflect those of the firm as a whole.

Any projections, targets, or estimates in this report are forward looking statements and are based on the firm’s research, analysis, and assumptions. Due to rapidly changing market conditions and the complexity of investment decisions, supplemental information and other sources may be required to make informed investment decisions based on your individual investment objectives and suitability specifications. All expressions of opinions are subject to change without notice. Clients should seek financial advice regarding the appropriateness of investing in any security or investment strategy discussed in this presentation.

Certain economic and market information contained herein has been obtained from published sources prepared by other parties.  Zacks Investment Management does not assume any responsibility for the accuracy or completeness of such information. Further, no third party has assumed responsibility for independently verifying the information contained herein and accordingly no such persons make any representations with respect to the accuracy, completeness or reasonableness of the information provided herein. Unless otherwise indicated, market analysis and conclusions are based upon opinions or assumptions that Zacks Investment Management considers to be reasonable. Any investment inherently involves a high degree of risk, beyond any specific risks discussed herein.

The S&P 500 Index is a well-known, unmanaged index of the prices of 500 large-company common stocks, mainly blue-chip stocks, selected by Standard & Poor’s. The S&P 500 Index assumes reinvestment of dividends but does not reflect advisory fees. The volatility of the benchmark may be materially different from the individual performance obtained by a specific investor. An investor cannot invest directly in an index.

The Russell 1000 Growth Index is a well-known, unmanaged index of the prices of 1000 large-company growth common stocks selected by Russell. The Russell 1000 Growth Index assumes reinvestment of dividends but does not reflect advisory fees. An investor cannot invest directly in an index. The volatility of the benchmark may be materially different from the individual performance obtained by a specific investor.

Nasdaq Composite Index is the market capitalization-weighted index of over 3,300 common equities listed on the Nasdaq stock exchange. The types of securities in the index include American depositary receipts, common stocks, real estate investment trusts (REITs) and tracking stocks, as well as limited partnership interests. The index includes all Nasdaq-listed stocks that are not derivatives, preferred shares, funds, exchange-traded funds (ETFs) or debenture securities. An investor cannot invest directly in an index. The volatility of the benchmark may be materially different from the individual performance obtained by a specific investor.

The Dow Jones Industrial Average measures the daily stock market movements of 30 U.S. publicly-traded companies listed on the NASDAQ or the New York Stock Exchange (NYSE). The 30 publicly-owned companies are considered leaders in the United States economy. An investor cannot directly invest in an index.  The volatility of the benchmark may be materially different from the individual performance obtained by a specific investor.

The Bloomberg Global Aggregate Index is a flagship measure of global investment grade debt from twenty-four local currency markets. This multi-currency benchmark includes treasury, government-related, corporate and securitized fixed-rate bonds from both developed and emerging markets issuers. An investor cannot invest directly in an index. The volatility of the benchmark may be materially different from the individual performance obtained by a specific investor.

The ICE Exchange-Listed Fixed & Adjustable Rate Preferred Securities Index is a modified market capitalization weighted index composed of preferred stock and securities that are functionally equivalent to preferred stock including, but not limited to, depositary preferred securities, perpetual subordinated debt and certain securities issued by banks and other financial institutions that are eligible for capital treatment with respect to such instruments akin to that received for issuance of straight preferred stock. An investor cannot invest directly in an index. The volatility of the benchmark may be materially different from the individual performance obtained by a specific investor.

The MSCI ACWI ex U.S. Index captures large and mid-cap representation across 22 of 23 Developed Markets (DM) countries (excluding the United States) and 24 Emerging Markets (EM) countries. The index covers approximately 85% of the global equity opportunity set outside the U.S. An investor cannot invest directly in an index. The volatility of the benchmark may be materially different from the individual performance obtained by a specific investor.

The Russell 2000 Index is a well-known, unmanaged index of the prices of 2000 small-cap company common stocks, selected by Russell. The Russell 2000 Index assumes reinvestment of dividends but does not reflect advisory fees. An investor cannot invest directly in an index. The volatility of the benchmark may be materially different from the individual performance obtained by a specific investor.

The S&P Mid Cap 400 provides investors with a benchmark for mid-sized companies. The index, which is distinct from the large-cap S&P 500, is designed to measure the performance of 400 mid-sized companies, reflecting the distinctive risk and return characteristics of this market segment.

The S&P 500 Pure Value index is a style-concentrated index designed to track the performance of stocks that exhibit the strongest value characteristics by using a style-attractiveness-weighting scheme. An investor cannot directly invest in an index.  The volatility of the benchmark may be materially different from the individual performance obtained by a specific investor.

Mitch Zacks – Weekly Market Commentary: The Story Isn’t the Rate Cut, It’s What Comes Next

By Weekly Market Commentary

The Federal Reserve delivered another 25-basis point rate cut at its December meeting, bringing the federal-funds range down to 3.50% to 3.75%. I would argue that the markets had priced in the outcome for weeks, and most investors already viewed it as a continuation of the Fed’s gradual effort to transition from “restrictive” toward something closer to neutral.1

The data heading into the meeting gave the Fed enough cover to ease, in my view. The latest inflation update, the September PCE report2, showed core prices rising 0.2% month-over-month and 2.8% year-over-year. Those aren’t perfect numbers, but they’re stable, and importantly, not accelerating meaningfully despite tariff pressure.

The labor market, meanwhile, has been showing signs of moderating but not collapsing. The most recent JOLTS3 report from the Bureau of Labor Statistics showed job openings easing to roughly 8.8 million, with quits rates drifting down—signs that both workers and employers are hanging tight. Employers are not on hiring or firing sprees, and workers are not switching jobs at a high rate. In short, there’s balance in the labor market, but it may be softer than what the Fed wants to see.

At the end of the day, concerns about the labor market appeared to outweigh concerns over inflation making downward progress towards the 2% target. Fed officials were divided over these two factors, but the compromise was what appeared to be a “cut-and-cap” approach: deliver the rate cut now, but make it clear that the bar for further easing is higher from here. That was my read from Chairman Powell’s posturing after the meeting.

In terms of where we go from here, investors often overestimate the economic impact of a quarter-point adjustment in the fed funds rate. Few long-term business projects suddenly become viable because the policy rate moves 25 bps lower. And markets also tend to price in anticipated Fed actions ahead of time, with mortgage, auto, and business-loan rates rarely moving one-for-one with the Fed.

Still, saying the impact is limited doesn’t mean it’s zero.

The first area where rate cuts can help is the yield curve, which has been flat for an unusually long stretch. While the curve has steepened slightly in recent months (see chart below), it remains close to flat. Lowering short-term rates generally encourages some natural steepening, which historically supports forward economic growth.

Source: Federal Reserve Bank of St. Louis4

The second area is bank lending, where the backdrop is already healthier than headlines imply. Growth in loans and leases has improved meaningfully over the past year, as seen on the chart below. Part of this comes down to simple economics. The average savings deposit rate at banks today is roughly 0.4%, while long-term lending rates—mortgages, commercial loans, consumer credit—are several percentage points higher. That spread gives banks strong incentives to lend, and a modest rate cut only reinforces that dynamic.

Source: Federal Reserve Bank of St. Louis5

Taken together, I think this modest rate cut will help at the margin, but I would not frame it as a catalyst that will all of a sudden drive a surge in economic activity. The economy is in relatively fine shape, and already being supported by steady lending, improving real wage trends, and corporate earnings that continue to exceed the more pessimistic forecasts from earlier this year. 25-basis points is not likely to move the needle dramatically, in my view.

Bottom Line for Investors

Investors often look to Fed decisions for clarity, but the more important takeaway from this meeting is what hasn’t changed, in my view. The expansion remains intact, even if it is slower and more uneven beneath the surface. A small rate cut is not going to change the economic narrative, but it may add a tailwind at a time when credit creation and corporate fundamentals still provide a reasonable foundation for continued growth. The Fed’s shift toward a “cut-and-cap” posture simply returns the focus to data rather than expectations, which is exactly where long-term investors should keep their focus as well.

Wall Street Journal. December 9, 2025. https://advisor.zacksim.com/e/376582/-cut-ef7118b8-mod-hp-lead-pos5/5tx571/1410802305/h/ZyUzHu-s3Ip9AAT83WrhDvgFCNCQXIyzPqdQDIIIkkA

CNBC. December 5, 2025. https://advisor.zacksim.com/e/376582/ion-report-september-2025-html/5tx574/1410802305/h/ZyUzHu-s3Ip9AAT83WrhDvgFCNCQXIyzPqdQDIIIkkA

BLS. 2025. https://advisor.zacksim.com/e/376582/news-release-jolts-nr0-htm/5tx577/1410802305/h/ZyUzHu-s3Ip9AAT83WrhDvgFCNCQXIyzPqdQDIIIkkA

Fred Economic Data. December 5, 2025. https://advisor.zacksim.com/e/376582/series-TOTLL/5tx57b/1410802305/h/ZyUzHu-s3Ip9AAT83WrhDvgFCNCQXIyzPqdQDIIIkkA

Fred Economic Data. December 5, 2025. https://advisor.zacksim.com/e/376582/series-TOTLL/5tx57b/1410802305/h/ZyUzHu-s3Ip9AAT83WrhDvgFCNCQXIyzPqdQDIIIkkA

DISCLOSURE
Past performance is no guarantee of future results. Inherent in any investment is the potential for loss.

Zacks Investment Management, Inc. is a wholly-owned subsidiary of Zacks Investment Research. Zacks Investment Management is an independent Registered Investment Advisory firm and acts as an investment manager for individuals and institutions. Zacks Investment Research is a provider of earnings data and other financial data to institutions and to individuals.

This material is being provided for informational purposes only and nothing herein constitutes investment, legal, accounting or tax advice, or a recommendation to buy, sell or hold a security. Do not act or rely upon the information and advice given in this publication without seeking the services of competent and professional legal, tax, or accounting counsel. Publication and distribution of this article is not intended to create, and the information contained herein does not constitute, an attorney-client relationship. No recommendation or advice is being given as to whether any investment or strategy is suitable for a particular investor. It should not be assumed that any investments in securities, companies, sectors or markets identified and described were or will be profitable. All information is current as of the date of herein and is subject to change without notice. Any views or opinions expressed may not reflect those of the firm as a whole.

Any projections, targets, or estimates in this report are forward looking statements and are based on the firm’s research, analysis, and assumptions. Due to rapidly changing market conditions and the complexity of investment decisions, supplemental information and other sources may be required to make informed investment decisions based on your individual investment objectives and suitability specifications. All expressions of opinions are subject to change without notice. Clients should seek financial advice regarding the appropriateness of investing in any security or investment strategy discussed in this presentation.

Certain economic and market information contained herein has been obtained from published sources prepared by other parties.  Zacks Investment Management does not assume any responsibility for the accuracy or completeness of such information. Further, no third party has assumed responsibility for independently verifying the information contained herein and accordingly no such persons make any representations with respect to the accuracy, completeness or reasonableness of the information provided herein. Unless otherwise indicated, market analysis and conclusions are based upon opinions or assumptions that Zacks Investment Management considers to be reasonable. Any investment inherently involves a high degree of risk, beyond any specific risks discussed herein.

The S&P 500 Index is a well-known, unmanaged index of the prices of 500 large-company common stocks, mainly blue-chip stocks, selected by Standard & Poor’s. The S&P 500 Index assumes reinvestment of dividends but does not reflect advisory fees. The volatility of the benchmark may be materially different from the individual performance obtained by a specific investor. An investor cannot invest directly in an index.

The Russell 1000 Growth Index is a well-known, unmanaged index of the prices of 1000 large-company growth common stocks selected by Russell. The Russell 1000 Growth Index assumes reinvestment of dividends but does not reflect advisory fees. An investor cannot invest directly in an index. The volatility of the benchmark may be materially different from the individual performance obtained by a specific investor.

Nasdaq Composite Index is the market capitalization-weighted index of over 3,300 common equities listed on the Nasdaq stock exchange. The types of securities in the index include American depositary receipts, common stocks, real estate investment trusts (REITs) and tracking stocks, as well as limited partnership interests. The index includes all Nasdaq-listed stocks that are not derivatives, preferred shares, funds, exchange-traded funds (ETFs) or debenture securities. An investor cannot invest directly in an index. The volatility of the benchmark may be materially different from the individual performance obtained by a specific investor.

The Dow Jones Industrial Average measures the daily stock market movements of 30 U.S. publicly-traded companies listed on the NASDAQ or the New York Stock Exchange (NYSE). The 30 publicly-owned companies are considered leaders in the United States economy. An investor cannot directly invest in an index.  The volatility of the benchmark may be materially different from the individual performance obtained by a specific investor.

The Bloomberg Global Aggregate Index is a flagship measure of global investment grade debt from twenty-four local currency markets. This multi-currency benchmark includes treasury, government-related, corporate and securitized fixed-rate bonds from both developed and emerging markets issuers. An investor cannot invest directly in an index. The volatility of the benchmark may be materially different from the individual performance obtained by a specific investor.

The ICE Exchange-Listed Fixed & Adjustable Rate Preferred Securities Index is a modified market capitalization weighted index composed of preferred stock and securities that are functionally equivalent to preferred stock including, but not limited to, depositary preferred securities, perpetual subordinated debt and certain securities issued by banks and other financial institutions that are eligible for capital treatment with respect to such instruments akin to that received for issuance of straight preferred stock. An investor cannot invest directly in an index. The volatility of the benchmark may be materially different from the individual performance obtained by a specific investor.

The MSCI ACWI ex U.S. Index captures large and mid-cap representation across 22 of 23 Developed Markets (DM) countries (excluding the United States) and 24 Emerging Markets (EM) countries. The index covers approximately 85% of the global equity opportunity set outside the U.S. An investor cannot invest directly in an index. The volatility of the benchmark may be materially different from the individual performance obtained by a specific investor.

The Russell 2000 Index is a well-known, unmanaged index of the prices of 2000 small-cap company common stocks, selected by Russell. The Russell 2000 Index assumes reinvestment of dividends but does not reflect advisory fees. An investor cannot invest directly in an index. The volatility of the benchmark may be materially different from the individual performance obtained by a specific investor.

The S&P Mid Cap 400 provides investors with a benchmark for mid-sized companies. The index, which is distinct from the large-cap S&P 500, is designed to measure the performance of 400 mid-sized companies, reflecting the distinctive risk and return characteristics of this market segment.

The S&P 500 Pure Value index is a style-concentrated index designed to track the performance of stocks that exhibit the strongest value characteristics by using a style-attractiveness-weighting scheme. An investor cannot directly invest in an index.  The volatility of the benchmark may be materially different from the individual performance obtained by a specific investor.